The attached charts illustrate the application of power laws in Bitcoin’s network growth and economic system. Power laws, which reveal exponential relationships between variables, are evident in Bitcoin’s adoption metrics, including its price, hash rate, and wallet distribution.
These graphs provide critical insights into how these factors interrelate and scale within the ecosystem.
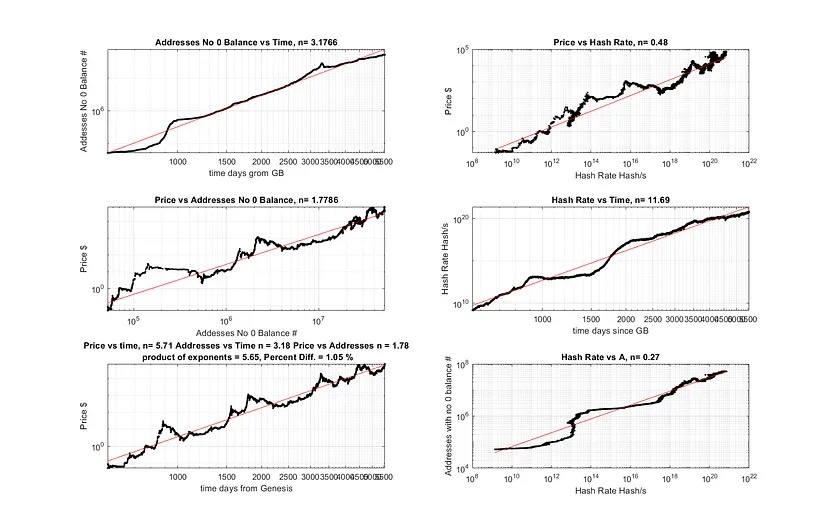
The chart labeled “Addresses No Balance vs. Time” shows the exponential increase in unique Bitcoin wallet addresses with a balance greater than zero.

Per the data, the power law exponent is approximately 3.18, reflecting an accelerating adoption rate as Bitcoin matures as an asset. This aligns with Zipf’s law in linguistics, where the rank-frequency distribution scales exponentially, showcasing how Bitcoin’s user adoption mirrors natural growth processes.
“Price vs. Hash Rate” reflects Bitcoin’s economic security dynamics. The chart demonstrates a power law relationship with an exponent of 0.48, showing that as the hash rate—indicative of mining difficulty—rises, Bitcoin’s price follows a slower but steady increase.
The correlation underscores Bitcoin’s network effect, where greater computational power enhances network security, attracting more participants and sustaining value.

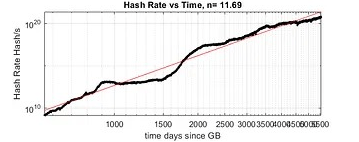
The “Hash Rate vs. Time” graph highlights the exponential increase in Bitcoin’s computational power over time, with an exponent of approximately 11.69.
This relationship underscores the sustained growth in mining activity, driven by advancements in mining hardware and the growing economic incentives tied to Bitcoin’s rising price.
The hash rate serves as a direct measure of network security, as higher computational power makes it increasingly difficult for bad actors to compromise the network.
The exponential nature of this graph reflects Bitcoin’s self-reinforcing cycle: as adoption and price rise, more miners are incentivized to join, contributing to greater network decentralization and robustness.
These charts collectively illuminate Bitcoin’s status as a self-organizing system, where network effects, adoption rates, and economic incentives drive exponential relationships.
Recognizing these dynamics offers valuable tools for forecasting its long-term trajectory, situating Bitcoin as both a technological and economic phenomenon.
BitcoinVersus.Tech Editor’s Note:
We volunteer daily to ensure the credibility of the information on this platform is Verifiably True. If you would like to support to help further secure the integrity of our research initiatives, please donate here
BitcoinVersus.tech is not a financial advisor. This media platform reports on financial subjects purely for informational purposes

Leave a comment