The top command in Linux provides real-time monitoring of system processes, resource usage, and performance metrics directly from the terminal.
It dynamically displays essential information, including CPU utilization, memory consumption, swap usage, and running tasks.
The interactive output updates automatically, offering an immediate overview of the system’s operational state, making it invaluable for troubleshooting, performance monitoring, and identifying resource-intensive processes.
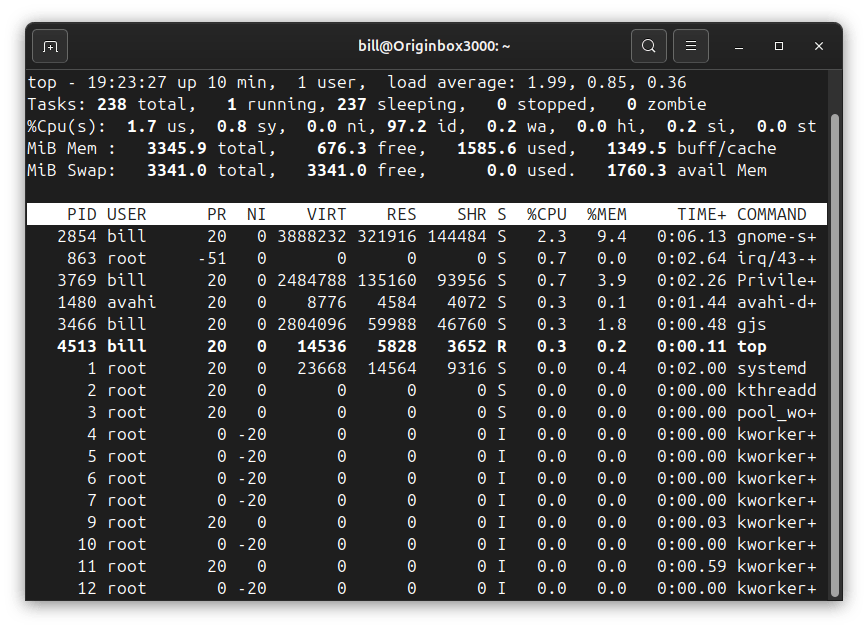
In the provided terminal screenshot, running top displays detailed system statistics.
The header summarizes overall system usage, such as uptime (10 minutes), number of users logged in (1 user), load averages indicating CPU activity over 1, 5, and 15 minutes (1.99, 0.85, 0.36 respectively), and CPU resource percentages.
Additionally, memory details including total, used, free, buffer/cache, and available memory are clearly visible.
Below the header is a dynamically updating table listing active processes, organized by their CPU and memory usage.
Each entry provides specific information: process ID (PID), user, priority (PR), virtual memory size (VIRT), resident memory (RES), shared memory (SHR), current process status (S), CPU usage percentage (%CPU), memory usage percentage (%MEM), accumulated CPU time (TIME+), and the command responsible for each process (COMMAND).
This detailed overview helps administrators quickly pinpoint processes that might be impacting system performance.
BitcoinVersus.Tech Editor’s Note:
We volunteer daily to ensure the credibility of the information on this platform is Verifiably True. If you would like to support to help further secure the integrity of our research initiatives, please donate here
BitcoinVersus.tech is not a financial advisor. This media platform reports on financial subjects purely for informational purposes.

Leave a comment