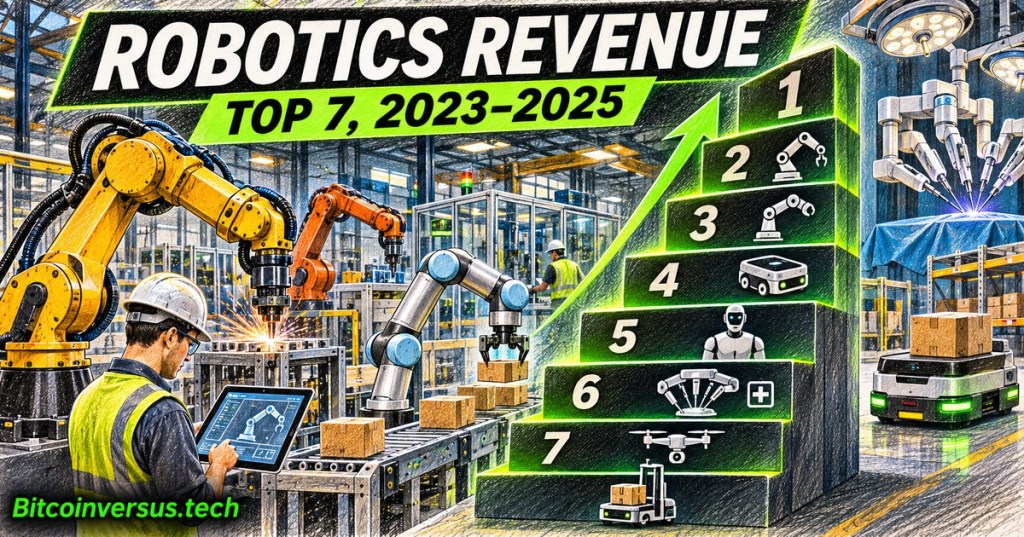
A fresh comparison of annual filings reveals sharply different revenue models across industrial robots, warehouse automation and robotic surgery. BitcoinVersus.Tech calculated cumulative 2023–2025 revenues for seven major businesses that separately disclose robotics-related sales. Intuitive Surgical dominates the selected group, while industrial-robot divisions show more cyclical results. The countdown measures reported sales, not valuations, profit, robot shipments or total market share.
Official Intuitive video introduces its da Vinci 5 surgical platform, illustrating the medical robot ecosystem behind the leading revenue total. Credit: Intuitive / YouTube, March 2024.
How the countdown was calculated
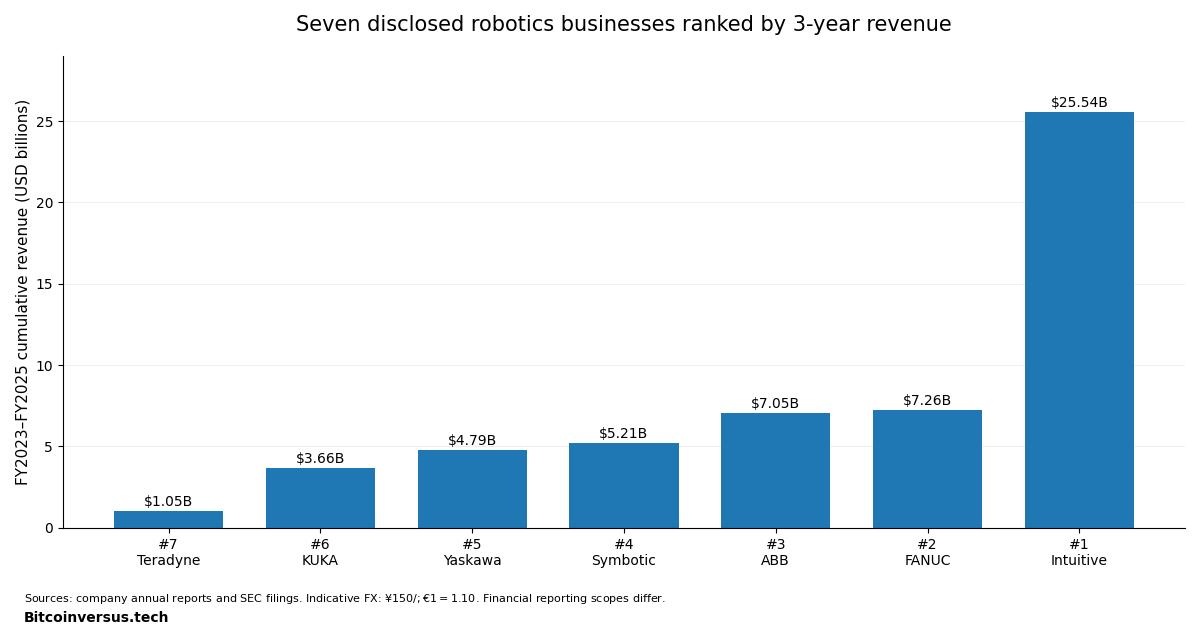
Each rank sums three annual figures for a robotics-focused company or a named robotics segment. Intuitive and Symbotic report consolidated operations centered on robotic systems; other entries use their explicitly disclosed robot divisions. For comparison, Japanese yen were converted at an illustrative constant ¥150 per dollar and KUKA’s euros at €1=$1.10. Historical annual foreign-exchange rates could modestly change dollar totals or close rankings. FY2023–FY2025 refer to each issuer’s fiscal-year labels, which do not all end in December. The list is a seven-company disclosed-revenue comparison, not an exhaustive global market ranking.
No. 7 — Teradyne Robotics: $1.05 billion
The Teradyne annual filing records $375.2 million in 2023, $364.8 million in 2024 and $308.3 million in 2025 from robotics, including Universal Robots and MiR. Sales fell 15.5% in 2025 as collaborative arms and autonomous mobile robots faced weak industrial demand.
No. 6 — KUKA Robotics: approximately $3.66 billion
KUKA’s 2024 report records €1,226.5 million for 2023 and €1,092.0 million for 2024; its 2025 report gives €1,010.7 million. Total: €3,329.2 million, or about $3.66 billion at the declared rate. The Robotics division excludes KUKA’s separate Systems, China and Swisslog segments.
No. 5 — Yaskawa Robotics: approximately $4.79 billion
Yaskawa’s investor materials report ¥234.7 billion in FY2023 and ¥237.4 billion in FY2024; FY2025 reached ¥247.0 billion. The ¥719.1 billion total converts to approximately $4.79 billion. Yaskawa’s motion-control sales are excluded.
No. 4 — Symbotic: $5.21 billion
The warehouse automation developer posted $1.177 billion in FY2023, $1.788 billion in FY2024 and $2.247 billion in FY2025, according to its SEC filing. The three-year total exceeds $5.21 billion, reflecting rapid adoption of automated distribution systems. Symbotic also reported a FY2025 net loss, demonstrating why rising sales should not be confused with profitability.
Official Symbotic factory-automation overview shows its autonomous warehouse systems. Credit: Symbotic / YouTube, January 2022. Product context rather than current financial evidence.
No. 3 — ABB Robotics: $7.05 billion
ABB’s 2025 financial report lists $2.267 billion in 2024 and $2.331 billion in 2025 for the robotics business. A SoftBank acquisition disclosure provides $2.452 billion for 2023. The combined $7.05 billion is narrower than ABB’s former Robotics & Discrete Automation business area, which also included machine automation.
No. 2 — FANUC Robot: approximately $7.26 billion
FANUC’s division disclosures show robot sales of ¥380.9 billion in FY2023 and ¥329.6 billion in FY2024, followed by ¥378.6 billion in FY2025. Their ¥1,089.1 billion total converts to around $7.26 billion. CNC, Robomachine and separately reported services are excluded.
No. 1 — Intuitive Surgical: $25.54 billion
The da Vinci surgical-robot developer reported $7.124 billion in 2023, $8.352 billion in 2024 and $10.065 billion in 2025, totaling $25.541 billion in its Form 10-K. Instruments, accessories and recurring services generate significant revenue beyond initial robot-system purchases. Its business model differs substantially from a welding-arm manufacturer.
What the totals reveal
The comparison illustrates why robotics requires careful accounting. Medical procedures create recurring instrument revenue; warehouses recognize large systems contracts; industrial manufacturers depend on capital-spending cycles. Our earlier reporting examined Standard Bots and the U.S.–China deployment gap, ranked industrial robot platforms, assessed labor impacts over 26 years, and covered warehouse robot development. Revenue is evidence of commercial scale, not proof of technical superiority.
Editor’s Note: Values were transcribed from Intuitive Surgical and Symbotic SEC filings, FANUC and Yaskawa investor disclosures, KUKA annual reports, ABB’s audited report and SoftBank’s transaction disclosure. Results cover reporting years 2023–2025 and retain each issuer’s defined robotics revenue scope. Constant currency rates are illustrative, not historical transaction conversions. The seven-company selection is not a comprehensive worldwide top-seven census. The featured cover is an original editorial illustration, the chart is original, and the older official YouTube demonstrations provide technical context rather than financial verification.

To donate 5,000 satoshis, scan the QR with a compatible Bitcoin wallet. On mobile, open the image with a wallet’s supported saved-image scanner or use a second screen. Verify the destination before transferring funds.
We volunteer daily to ensure the information on this platform is Verifiably True. If you would like to support the research, please scan QR code.


Leave a Reply