
By Jules Porter | October 10, 2026
U.S. spot Bitcoin ETFs just produced a $920 million week-over-week reversal. The prior trading week finished with $241.1 million in net inflows. The five trading days ending October 9 finished with $678.9 million in net outflows, using the day-by-day table published by Farside Investors.
The important number is not merely the latest outflow. It is the change between the two weeks:
-$678.9M – (+$241.1M) = -$920.0M.
That is a $920.0 million negative swing in weekly ETF demand. The magnitude of the latest weekly outflow was also 2.82 times the size of the previous week’s inflow: $678.9M ÷ $241.1M = 2.8167.
The Daily Bitcoin ETF Flow Chart
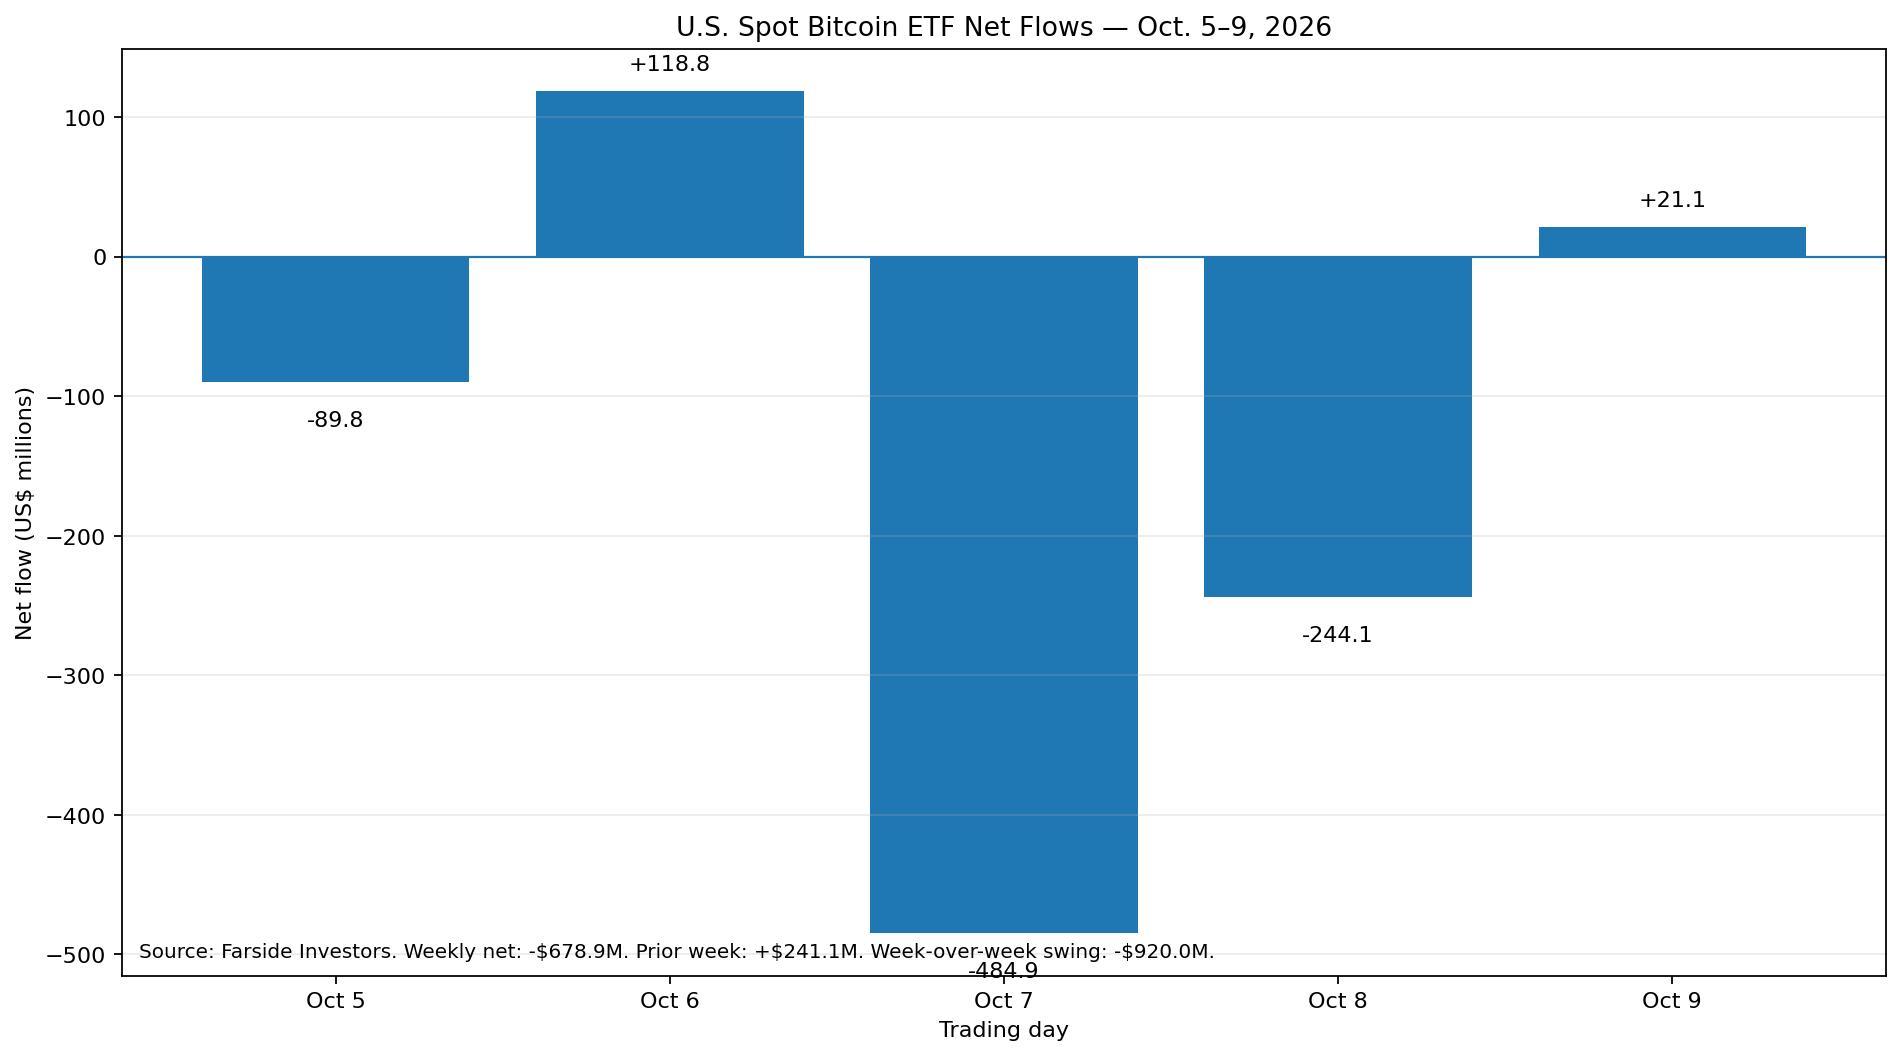
| Date | Net ETF flow |
|---|---|
| Oct. 5 | -$89.8M |
| Oct. 6 | +$118.8M |
| Oct. 7 | -$484.9M |
| Oct. 8 | -$244.1M |
| Oct. 9 | +$21.1M |
| Week | -$678.9M |
The source is Farside Investors’ U.S. Bitcoin ETF flow table. Adding the five daily observations gives the weekly result directly:
-$89.8M + $118.8M – $484.9M – $244.1M + $21.1M = -$678.9M.
Two Days Did Most of the Damage
October 7 and October 8 produced -$729.0 million combined:
-$484.9M + -$244.1M = -$729.0M.
That two-day loss was larger than the entire week’s final net outflow because positive flows on October 6 and October 9 offset part of the damage. Those two positive sessions totaled +$139.9 million.
October 7 alone represented an amount equal to about 71.4% of the week’s final net outflow magnitude: $484.9M ÷ $678.9M = 0.7143.
The Prior Week Was Positive by $241.1 Million
The week ending October 2 looked very different. Farside’s daily totals were:
+$31.0M + $66.2M – $148.7M + $102.7M + $189.9M = +$241.1M.
That makes the reversal unusually easy to visualize. One week ended with a quarter-billion dollars of net creations. The next ended with nearly $679 million of net redemptions.
Why You May See $681.1 Million Somewhere Else
The Block reported $681.1 million of weekly Bitcoin ETF outflows, while summing the current Farside daily table gives $678.9 million. The difference is only $2.2 million, or about 0.32% of the Farside weekly outflow magnitude.
Small differences like this can appear because ETF-flow datasets are refreshed at different times or incorporate late updates. BitcoinVersus.Tech uses the current Farside daily observations for the chart and every calculation in this article so the arithmetic can be reproduced from the table above.
ETF Flows Are Demand Data, Not a Price Formula
A negative ETF week does not mathematically require Bitcoin’s price to fall by a particular percentage. ETF flows measure creations and redemptions inside one major access channel. Bitcoin still trades globally through spot exchanges, derivatives, OTC desks and direct custody.
This is similar to the point in our older technical review of Bitcoin’s price: no single market variable fully determines price. ETF flows are one measurable source of marginal demand, not a complete pricing equation.
The Bigger Context: Bitcoin’s Market Can Absorb More Flow Than Before
The ETF reversal is happening as Bitcoin’s underlying market liquidity has improved. In our newly published Bitcoin liquidity review, 1% order-book depth had risen to roughly $11.7 million—about 75% deeper than on the October 2025 crash day.
That does not make $679 million of ETF outflows irrelevant. It means the market structure receiving those flows is not identical to the one that existed a year ago.
Why Miners Should Watch the Chart
Bitcoin miners care because ETF demand can influence the same BTC price that drives dollar-denominated hashprice. When price improves, mining revenue can rise even if block-space fees remain weak. BitcoinVersus.Tech recently showed this in Bitcoin Miner Revenue Rebounded 78%.
The useful operating signal is therefore not “ETF outflow equals miner trouble.” It is whether ETF flow direction persists long enough to affect Bitcoin’s price, and whether that price move is large enough to change hashprice relative to power cost.
Bottom Line
The latest Bitcoin ETF story is best understood as a reversal in measurable demand. The market moved from +$241.1 million one week to -$678.9 million the next. The exact week-over-week change is -$920.0 million.
That is the number worth tracking next week. If ETF flows turn positive again, this week’s move may prove temporary. If another large negative week follows, the chart will begin to show a sustained institutional-flow trend rather than a one-week reversal.
Editor’s Note: ETF flow figures can be revised after initial publication. All calculations in this article use the Farside Investors daily table as retrieved on October 10, 2026. Values are rounded to the nearest $0.1 million before addition, so small differences can exist versus providers using unrounded or differently timed source data.
BitcoinVersus.Tech independently researches Bitcoin, mining hardware, semiconductors, data centers and computing infrastructure. Donations help fund additional open technical publishing: 3C9o19EH5HSiwEPyCTmEKzxhNCbo2X6TTb
BitcoinVersus.tech is not a financial advisor. Content is provided for informational purposes.


Leave a Reply