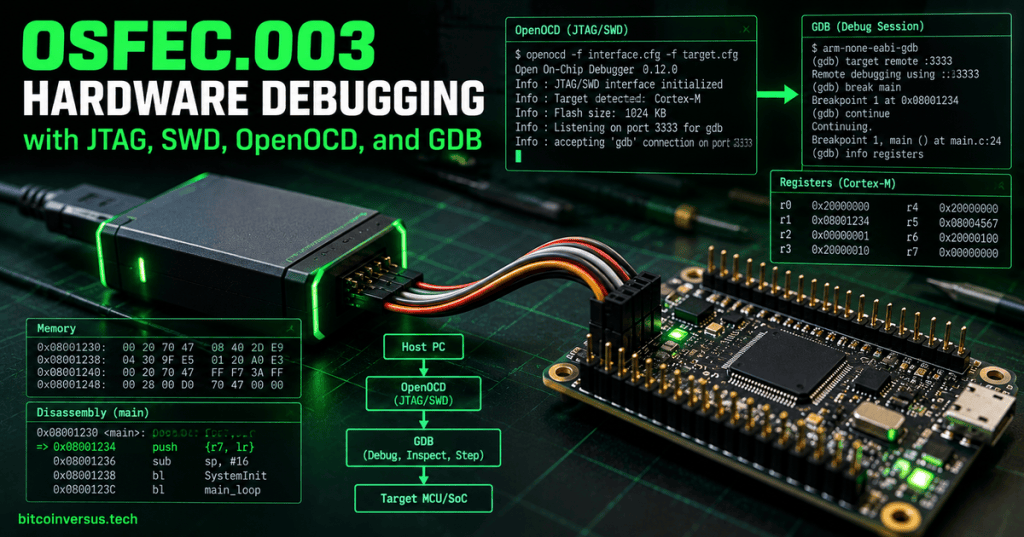
Hardware debugging gives a firmware engineer controlled access to a running processor below the application interface. A debug probe and target debug port can halt execution, inspect registers and memory, set breakpoints, single-step instructions, and expose failures that logs alone cannot explain.
OSFEC.003 continues the Open Source Firmware Engineer Certification from OSFEC.002: Real-Time Firmware Scheduling. It also builds on OSFEC.001: Microcontroller Architecture and the recovery workflow in OSFTC.003: Firmware Backup and Recovery.
Learning objectives
- Explain the roles of JTAG, SWD, a debug probe, OpenOCD, and GDB.
- Establish a target connection without assuming voltage, interface, or device configuration.
- Use halt, continue, step, next, breakpoints, register reads, memory reads, and backtraces.
- Relate source-level debugging to machine state and the target memory map.
- Recognize optimized-code, timing, reset, and concurrency effects that can mislead a debugger.
- Build a repeatable evidence-first debugging workflow.
The hardware-debugging stack
The debugging path contains several layers. The target MCU or SoC exposes a hardware debug interface such as JTAG or Arm Serial Wire Debug. A physical probe translates that electrical protocol to a host connection. OpenOCD can control the probe and expose a GDB server, while GDB provides source-level and machine-level inspection.
Host workstation
      |
      v
GDB client    OpenOCD
                              |
                              v
                         Debug probe
                              |
                         JTAG or SWD
                              |
                              v
                         Target MCU/SoC
JTAG and SWD
JTAG commonly uses TCK, TMS, TDI, and TDO plus ground and optional reset signals. SWD uses SWCLK and bidirectional SWDIO for Arm debug access, reducing pin count. Neither interface should be connected from appearance alone: the engineer must verify the board pinout, target reference voltage, ground, reset behavior, and processor documentation.
OpenOCD as the bridge
Open On-Chip Debugger, commonly called OpenOCD, provides a software layer between a supported probe and a target. Its configuration identifies the adapter, transport, and target family. When the connection succeeds, OpenOCD can provide services such as a GDB server so a debugger can control the target through a standard remote-debugging protocol.
openocd -f interface/<probe>.cfg -f target/<target>.cfg

# A common GDB-server endpoint is localhost:3333.
# Use the exact interface and target configuration for the hardware.
GDB remote debugging
GDB can load symbol information from the compiled ELF file while the executable code runs on the target. The symbol file maps machine addresses to functions, variables, types, and source lines. The remote connection then lets GDB ask OpenOCD to halt, resume, read state, and manage breakpoints on the physical processor.
arm-none-eabi-gdb build/firmware.elf
(gdb) target extended-remote :3333
(gdb) monitor reset halt
(gdb) break main
(gdb) continue
Breakpoints
A breakpoint stops execution when the processor reaches a selected address or source location. Hardware breakpoints are especially important when code executes from flash, because flash cannot generally be patched like RAM to insert a software breakpoint. Microcontrollers therefore have a finite number of hardware breakpoint resources.
(gdb) break main
(gdb) break control_loop
(gdb) info breakpoints
(gdb) disable 2
(gdb) delete 2
Stepping through code
The commands step and next answer different questions. Step enters a called function when debug information permits it, while next generally executes the current source line without descending into each call. At the instruction level, stepi and nexti operate on machine instructions and are useful when source-level behavior is distorted by optimization or startup assembly.
(gdb) step
(gdb) next
(gdb) stepi
(gdb) nexti
(gdb) continue
Registers and processor state
Register inspection connects source code to the architecture introduced in OSFEC.001. The program counter indicates the current execution address, the stack pointer locates the active stack, general-purpose registers hold intermediate state, and processor status registers describe execution mode and condition state. On a fault, these values can reveal where execution stopped and what context was active.
(gdb) info registers
(gdb) p/x $pc
(gdb) p/x $sp
(gdb) x/16wx $sp
Memory inspection
GDB’s examine command can display memory using an address, count, format, and unit size. Firmware engineers use memory reads to inspect stacks, buffers, peripheral registers, vector tables, and known structures. An address should always be interpreted through the target memory map; a numeric value without architectural context can be misleading.
(gdb) x/16wx 0x20000000
(gdb) x/32bx buffer
(gdb) p/x variable
(gdb) p *pointer
Call stacks and backtraces
A backtrace reconstructs the active chain of function calls from available stack and debug information. It is often the fastest way to determine how execution reached a fault or breakpoint. Corrupted stacks, aggressive optimization, exception frames, hand-written assembly, or missing unwind information can make a backtrace incomplete, so it should be treated as evidence rather than infallible truth.
(gdb) backtrace
(gdb) frame 0
(gdb) info locals
(gdb) up
(gdb) down
Watchpoints
A watchpoint asks the debugger to stop when a selected memory value changes. This is valuable when a variable is being corrupted but the writing code is unknown. Hardware watchpoint resources are limited, and the supported access sizes and address alignments depend on the processor’s debug architecture.
(gdb) watch shared_state
(gdb) rwatch status_register
(gdb) awatch buffer[0]
(gdb) info watchpoints
Optimization changes what the debugger sees
Optimized firmware does not preserve a one-to-one relationship between source lines and machine instructions. Variables can be kept only in registers, folded into constants, reordered, or eliminated. Functions can be inlined. When a debugger reports that a variable is optimized out, the engineer should inspect disassembly, registers, compiler options, and the generated ELF rather than assuming the debugger is defective.
Debugging can change timing
Halting a processor changes the behavior of a real-time system. Peripherals, watchdogs, DMA engines, network peers, motor-control hardware, and external devices may continue operating while the CPU is stopped, or they may stop depending on debug-freeze configuration. A bug that disappears under single-stepping may therefore be a timing-sensitive Heisenbug rather than a solved problem.
Reset and connect-under-reset
Some firmware becomes difficult to attach to after startup because it changes clocks, enters low-power modes, remaps pins, triggers a watchdog, or configures security features. A probe that supports connect-under-reset can establish debug control while reset is asserted or during the reset sequence, allowing the engineer to halt before the problematic firmware state develops.
Fault debugging workflow
A disciplined fault investigation begins by preserving state. Before modifying flash or repeatedly resetting the system, capture the program counter, stack pointer, fault-status registers, backtrace, relevant memory, firmware build identity, and reproduction conditions. This makes the investigation repeatable and protects evidence that may disappear after recovery actions.
- Record exact hardware revision and target device.
- Record firmware version, ELF/build ID, compiler, and optimization level.
- Connect at a conservative debug clock.
- Halt only when necessary and record whether peripherals continue running.
- Capture registers, backtrace, stack memory, and fault registers.
- Compare addresses against the exact ELF and map file.
- Reproduce with the smallest controlled change.
- Verify the fix under normal timing without a debugger attached.
A minimal OpenOCD and GDB session
The following sequence illustrates the shape of a basic session, not a universal command recipe. Probe names, target files, reset configuration, executable names, architecture-specific GDB binaries, and server ports vary. The board and tool documentation should define the authoritative configuration.
openocd -f interface/probe.cfg -f target/target.cfg

# In another terminal:
arm-none-eabi-gdb build/firmware.elf
(gdb) target extended-remote localhost:3333
(gdb) monitor reset halt
(gdb) info registers
(gdb) break main
(gdb) continue
(gdb) next
(gdb) backtrace
Exercises
- Draw the complete path from GDB to a target MCU when OpenOCD and an SWD probe are used.
- Explain why the ELF file is more useful to GDB than a raw .bin image.
- Create a command sequence that halts a target, prints registers, inspects 16 words of SRAM, sets a breakpoint at main, and resumes.
- Explain why a hardware breakpoint may be required for code executing from flash.
- Describe how a watchpoint could identify an unexpected write to a shared state variable.
- List three reasons a backtrace might be incomplete or misleading.
- Explain how halting a processor can change watchdog, DMA, or real-time behavior.
- Design an evidence checklist for investigating a Cortex-M hard fault.
Knowledge check
- What does OpenOCD do?
It connects supported debug adapters and targets and can expose services such as a GDB server for hardware debugging. - Why does GDB need the ELF file?
The ELF can contain executable layout, symbols, types, addresses, and debug information that map machine state back to source code. - What is the difference between a breakpoint and a watchpoint?
A breakpoint stops at an execution location; a watchpoint stops when a selected memory access or value change occurs. - Why can optimized firmware look strange in GDB?
The compiler may inline, reorder, combine, move, or eliminate source-level objects while preserving program semantics. - Why can single-stepping hide a bug?
Stopping execution changes timing and interactions with interrupts, peripherals, DMA, watchdogs, and external systems. - What should be captured before destructive recovery?
Build identity, registers, fault state, stack/backtrace evidence, relevant memory, hardware revision, and reproduction conditions.
Key takeaway
Hardware debugging is an evidence system, not merely a way to pause code. JTAG or SWD exposes processor debug access, a probe connects that interface to the host, OpenOCD can translate probe and target operations into a remote-debugging service, and GDB turns machine state into inspectable source-level information. Strong firmware engineering uses those layers deliberately while accounting for optimization, timing changes, limited hardware debug resources, and the possibility that the debugger itself changes system behavior.
Engineering note: Debug access can halt safety-critical control, modify memory, erase flash, change security state, and alter timing. Production debugging must follow the target vendor documentation, electrical limits, organizational authorization, ESD requirements, and system safety procedures.
BitcoinVersus.Tech
Advertisement
Editor’s Note:
We volunteer daily to ensure the credibility of the information on this platform is Verifiably True. If you would like to support our research initiatives, please donate here: 3C9o19EH5HSiwEPyCTmEKzxhNCbo2X6TTb
BitcoinVersus.tech is not a financial advisor. This media platform reports on financial subjects purely for informational purposes.


Leave a Reply