
Cloudflare says it stopped 18.2 million network-layer distributed denial-of-service (DDoS) attacks in the third quarter of 2026, a 208% increase from the same quarter a year earlier. Its October 29 threat report counted about 8,226 attacks per hour during July through September. Yet its largest floods became less frequent, revealing a shift in both attack size and operating tactics.
A DDoS attack overwhelms a service with unwanted requests or packets, often originating from compromised devices. Network-layer attacks exhaust bandwidth, routers or connection-handling capacity; HTTP-layer attacks instead target web application resources. Cloudflare separately reported 14.4 trillion malicious HTTP requests, a request count rather than 14.4 trillion distinct attack campaigns.
Cloudflare, “DDoS attacks 101: What are they and how to protect your site?” (April 3, 2014). Archival explainer of amplification and mitigation, not video of Q3 2026. Credit: Cloudflare / YouTube.
More attacks, fewer terabit-scale floods
Cloudflare reports that 96% of its mitigated network-layer attacks lasted under 10 minutes and 98% remained below 1 gigabit per second (Gbps). Such traffic can still overwhelm smaller servers or internet links. The network-layer count rose sharply year over year, while incidents above 1 terabit per second (Tbps) fell from 805 in the second quarter to 251 in the third, a 68.8% quarterly decline calculated from the company’s counts.
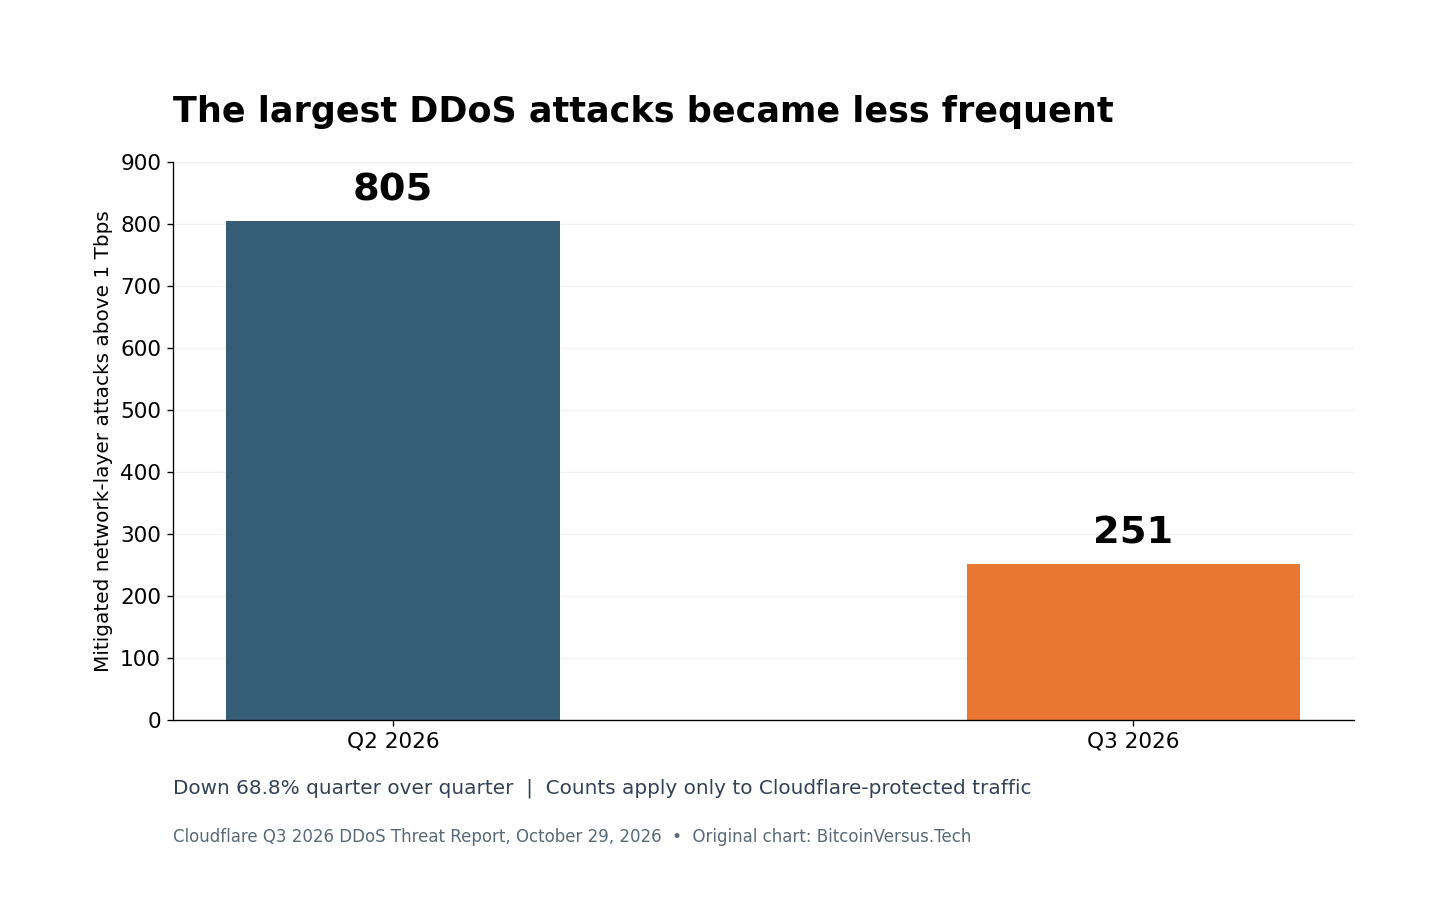
Cloudflare suggests earlier law-enforcement action against major internet-of-things botnets may have influenced the reduction. Timing alone cannot establish causation: the company’s earlier first-half report showed terabit-scale attacks rising in Q2 after the reported disruptions. New botnet variants also remain active. The shift deserves monitoring, not a declaration that large-scale attacks have ended.
UDP floods gain share as amplification methods change
Attack composition changed as well. Generic User Datagram Protocol (UDP) floods accounted for 31.31% of network-layer attacks in Q3, up from 14.06% in Q2, an increase of 17.25 percentage points. DNS amplification attacks rose 215% and reached 3.43% of network-layer attacks. CLDAP floods, involving connectionless directory-service replies, dropped 99.5% from the prior quarter to just 0.05% of attacks.
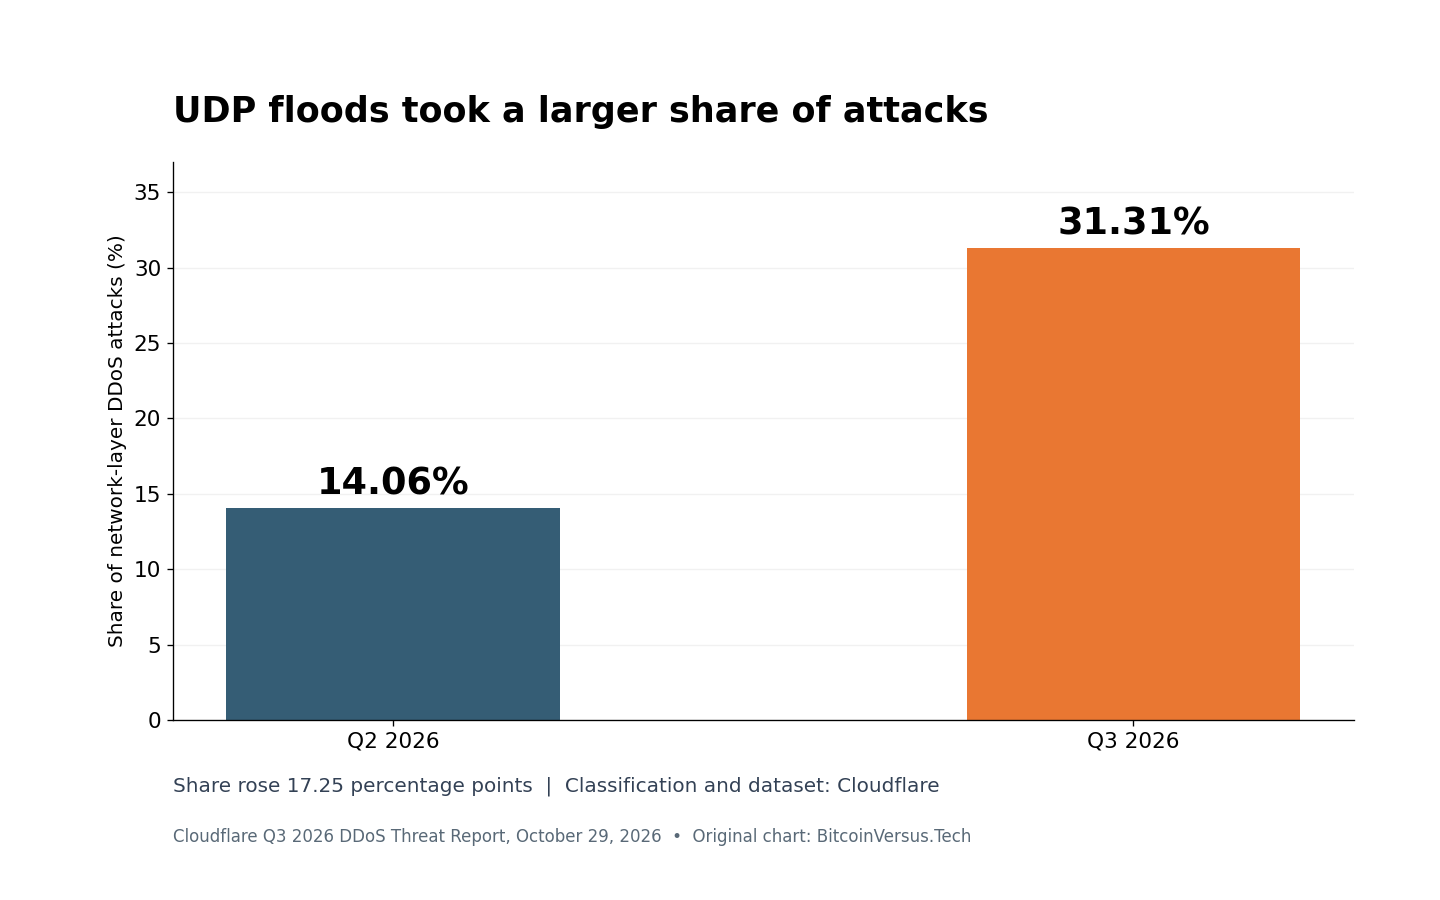
UDP does not establish a connection before sending packets. Spoofed-source requests can also exploit publicly reachable DNS resolvers or directory services as amplifiers, directing larger responses toward a victim. Protective architecture can combine Anycast routing, a distributed content delivery network, source-address validation and correctly configured DNS services. None provides immunity by itself.
What the statistics can and cannot prove
The United States ranked first among destinations attacked on Cloudflare’s network, followed by China and Indonesia. Those positions describe a security provider’s observed customers and routing footprint, not every target worldwide. Similarly, Cloudflare’s reported 272.6 petabytes of mitigated network-layer traffic is a volume measure, not a count of compromised devices or confirmed business outages.
BitcoinVersus.Tech previously covered NETSCOUT’s first-half DDoS findings. The two organizations observe different networks, define events differently and cannot be ranked by raw totals. The new Cloudflare data instead strengthens a practical conclusion: detection and filtering must operate within seconds, while engineers test sub-gigabit floods as well as extreme multi-terabit events.
Primary sources: Cloudflare Q3 2026 DDoS Threat Report, published October 29; Cloudflare’s H1 2026 report, published August 11. Cross-check: The Hacker News, October 31. Company telemetry has not been independently audited for the article.
Editor’s Note: The quarterly attack totals, rates, distribution and vectors come from Cloudflare’s October 29 report. The 208% annual increase refers to network-layer attacks overall; the report’s summary also applies that figure to short, low-bandwidth attacks without presenting a separate denominator. The 68.8% decline and 17.25-percentage-point change are arithmetic calculations. Both charts are original data visualizations; the featured cover is conceptual artwork. The Cloudflare video predates the study and supplies technical background, not 2026 attack footage.
To contribute 5,000 satoshis to independent research, scan the original donation QR code on another screen with a compatible Bitcoin wallet. If your wallet supports scanning a saved image, save the QR and import it. Verify the destination and amount before paying.

We volunteer daily to ensure the information on this platform is Verifiably True. If you would like to support the research, please scan the QR code.
BitcoinVersus.Tech provides technical reporting for informational and educational purposes.


Leave a Reply