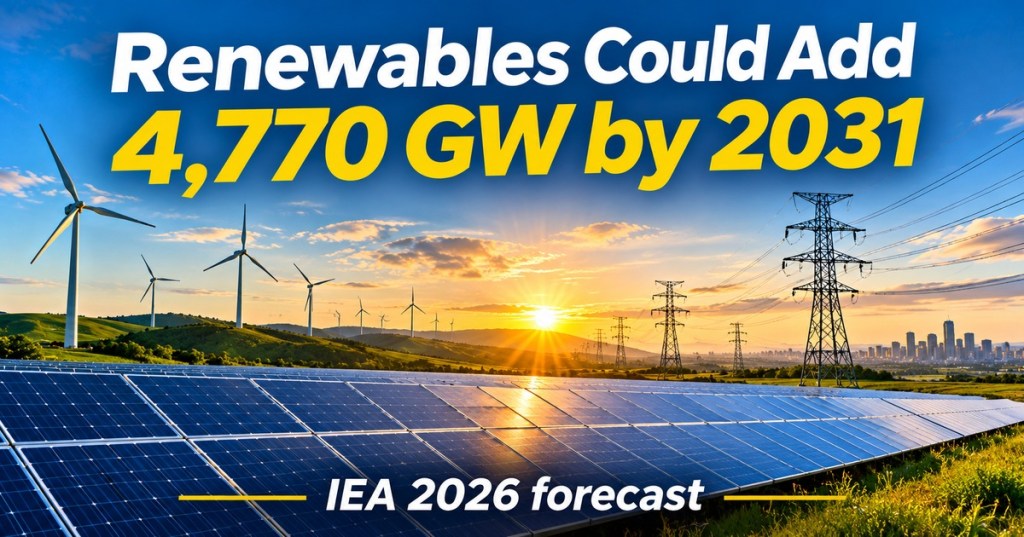
Global renewable electricity capacity could increase by more than 4,770 gigawatts during 2026–2031, approximately 57% more than in the preceding six-year period, according to the International Energy Agency’s Renewables 2026 report published November 6. Solar power supplies roughly three-quarters of the projected expansion, but another statistic exposes the infrastructure challenge: 3,000 GW of advanced renewable and storage projects are waiting for grid connections worldwide. The figures describe different measures—new generating capacity, technology mix and a connection queue—not electricity already delivered.
Six-year renewable expansion accelerates
The IEA’s main-case forecast exceeds 4,770 GW of net additional renewable power capacity over 2026–2031, compared with approximately 3,040 GW during 2020–2025. The historical figure is an approximation derived from the report’s rounded 57% growth statement. Gigawatts measure power-generating capacity, not actual annual production in terawatt-hours. Weather, capacity factors, curtailment and dispatch determine how much electricity installed facilities ultimately generate.
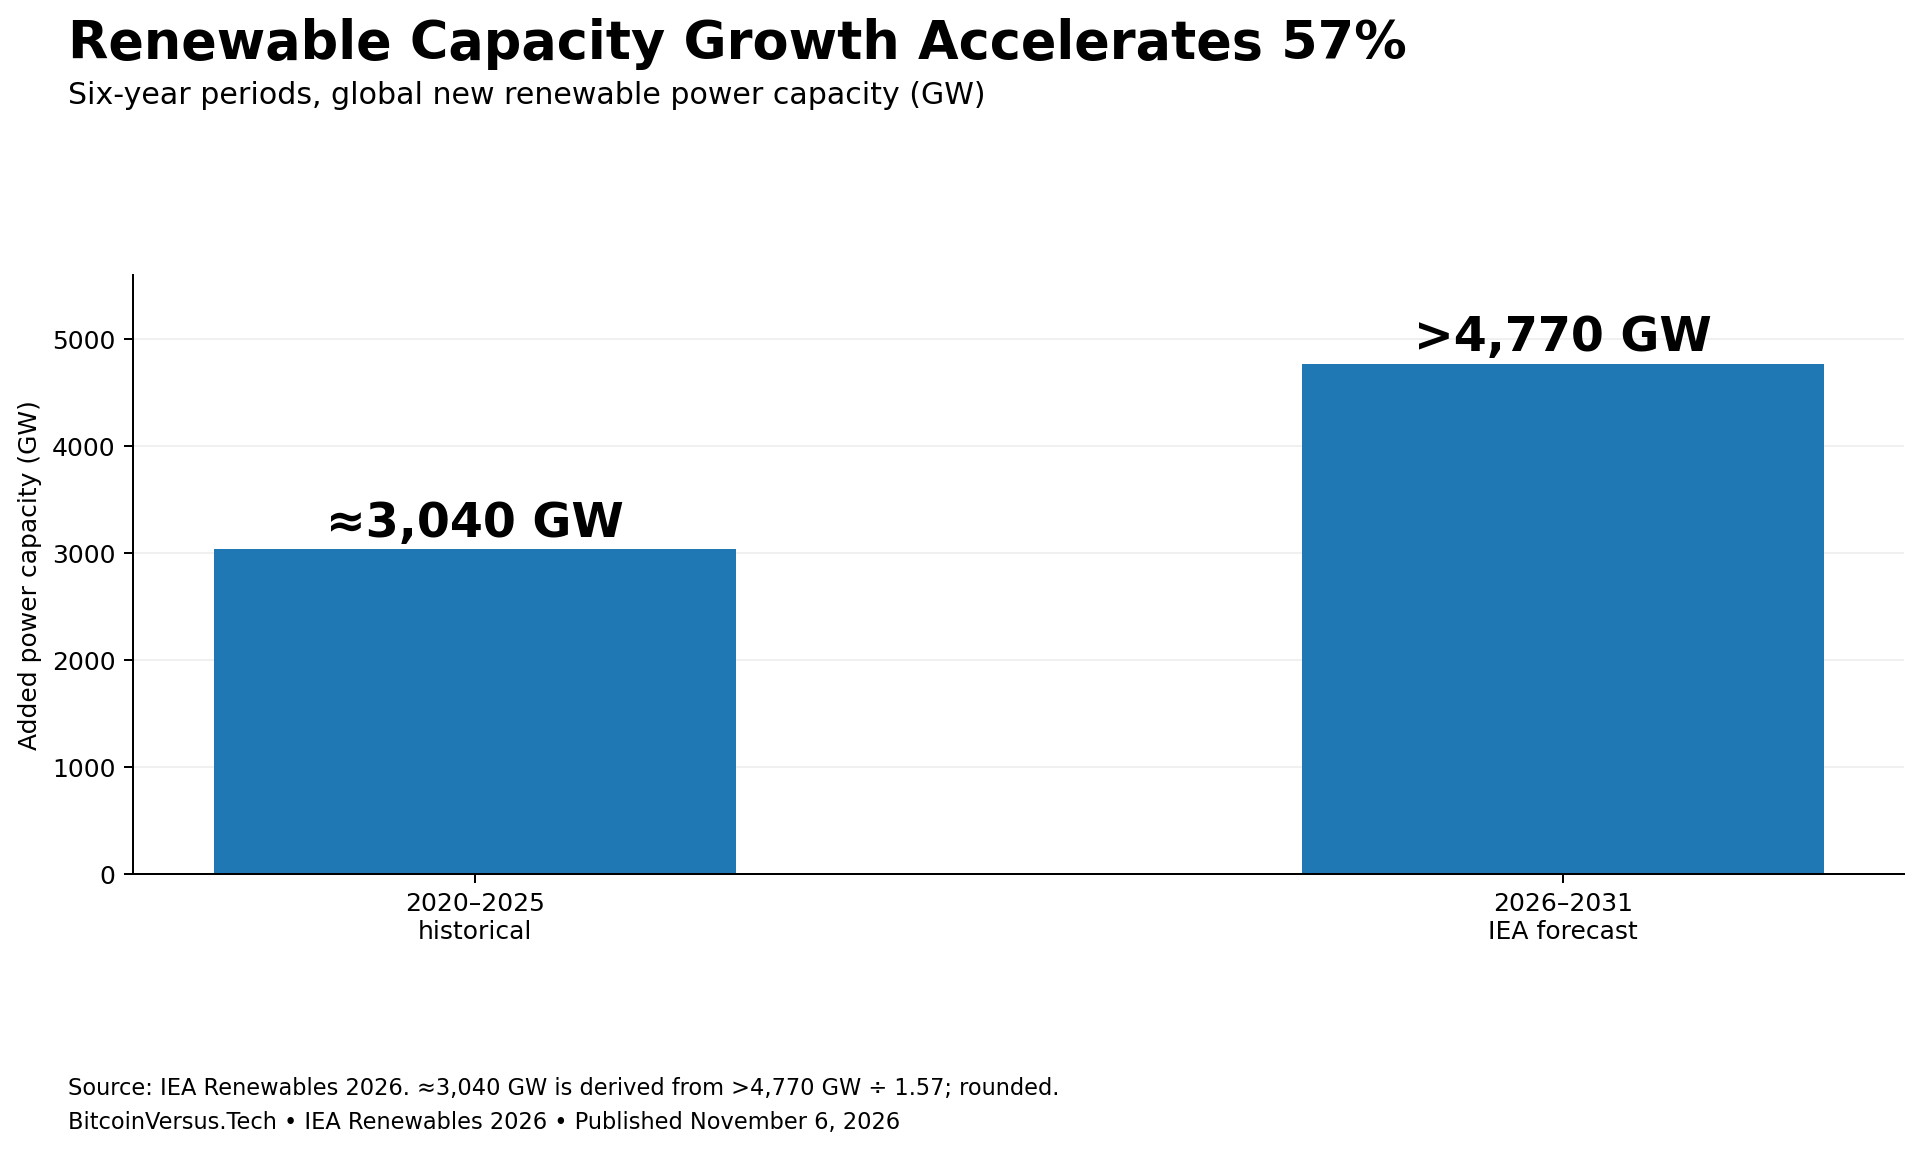
The trajectory does not imply uninterrupted annual records. The IEA expects new renewable additions to dip 11% to about 733 GW in 2026, largely reflecting a policy-related slowdown in China, before longer-term deployment accelerates. Earlier BitcoinVersus.Tech reporting tracked which countries added the most renewable capacity through 2025; the new outlook extends the analysis into the future rather than reporting verified construction.
Solar power accounts for most new capacity
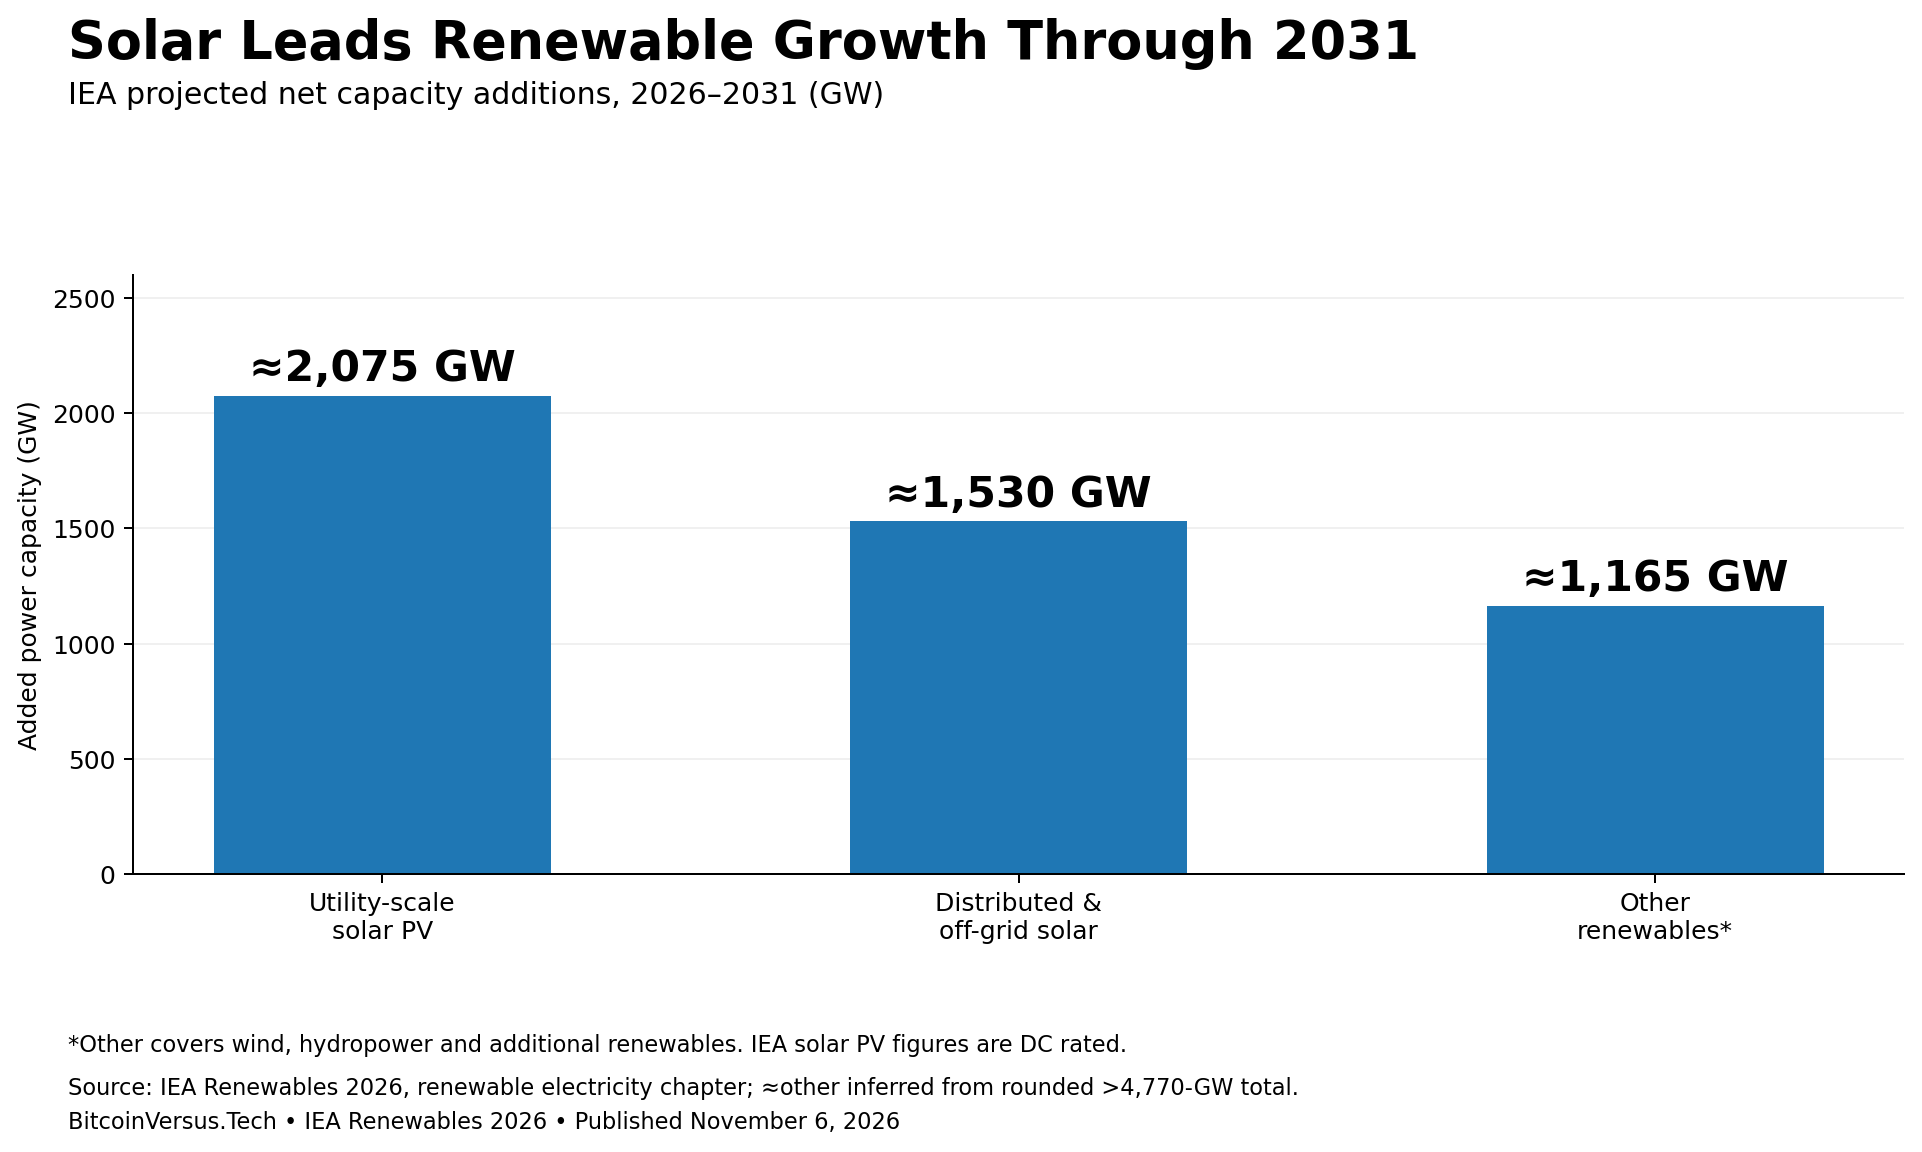
The IEA renewable-electricity chapter projects 2,075 GW of utility-scale solar and another 1,530 GW of distributed solar, including residential, business and off-grid systems. Together, approximately 3,605 GW of additional photovoltaic capacity represents just over three-quarters of the forecast global renewable increase. The remaining roughly 1,165 GW represents wind, hydropower and other technologies, calculated as a rounded residual rather than a separately published IEA total.
China is still expected to contribute 53% of the world’s new renewable capacity, although its contribution falls from more than 60% in 2025. India becomes the second-largest national growth market. The IEA raised its U.S. renewable forecast by almost 40% versus last year’s outlook, largely because solar and batteries can be constructed relatively quickly. BitcoinVersus.Tech previously examined solar’s historical rise and the expansion of U.S. solar-plus-storage projects.
Grid queues could delay the buildout
A bottleneck lies between project approval and electricity delivery. The IEA reports that advanced-stage renewable and storage projects waiting for grid connections increased 60% in one year to 3,000 GW. That implies roughly 1,875 GW in the prior year using the report’s rounded percentages. Battery and hybrid project applications accounted for the entire reported increase. A queued project is not equivalent to an operating generator or an assured future connection.
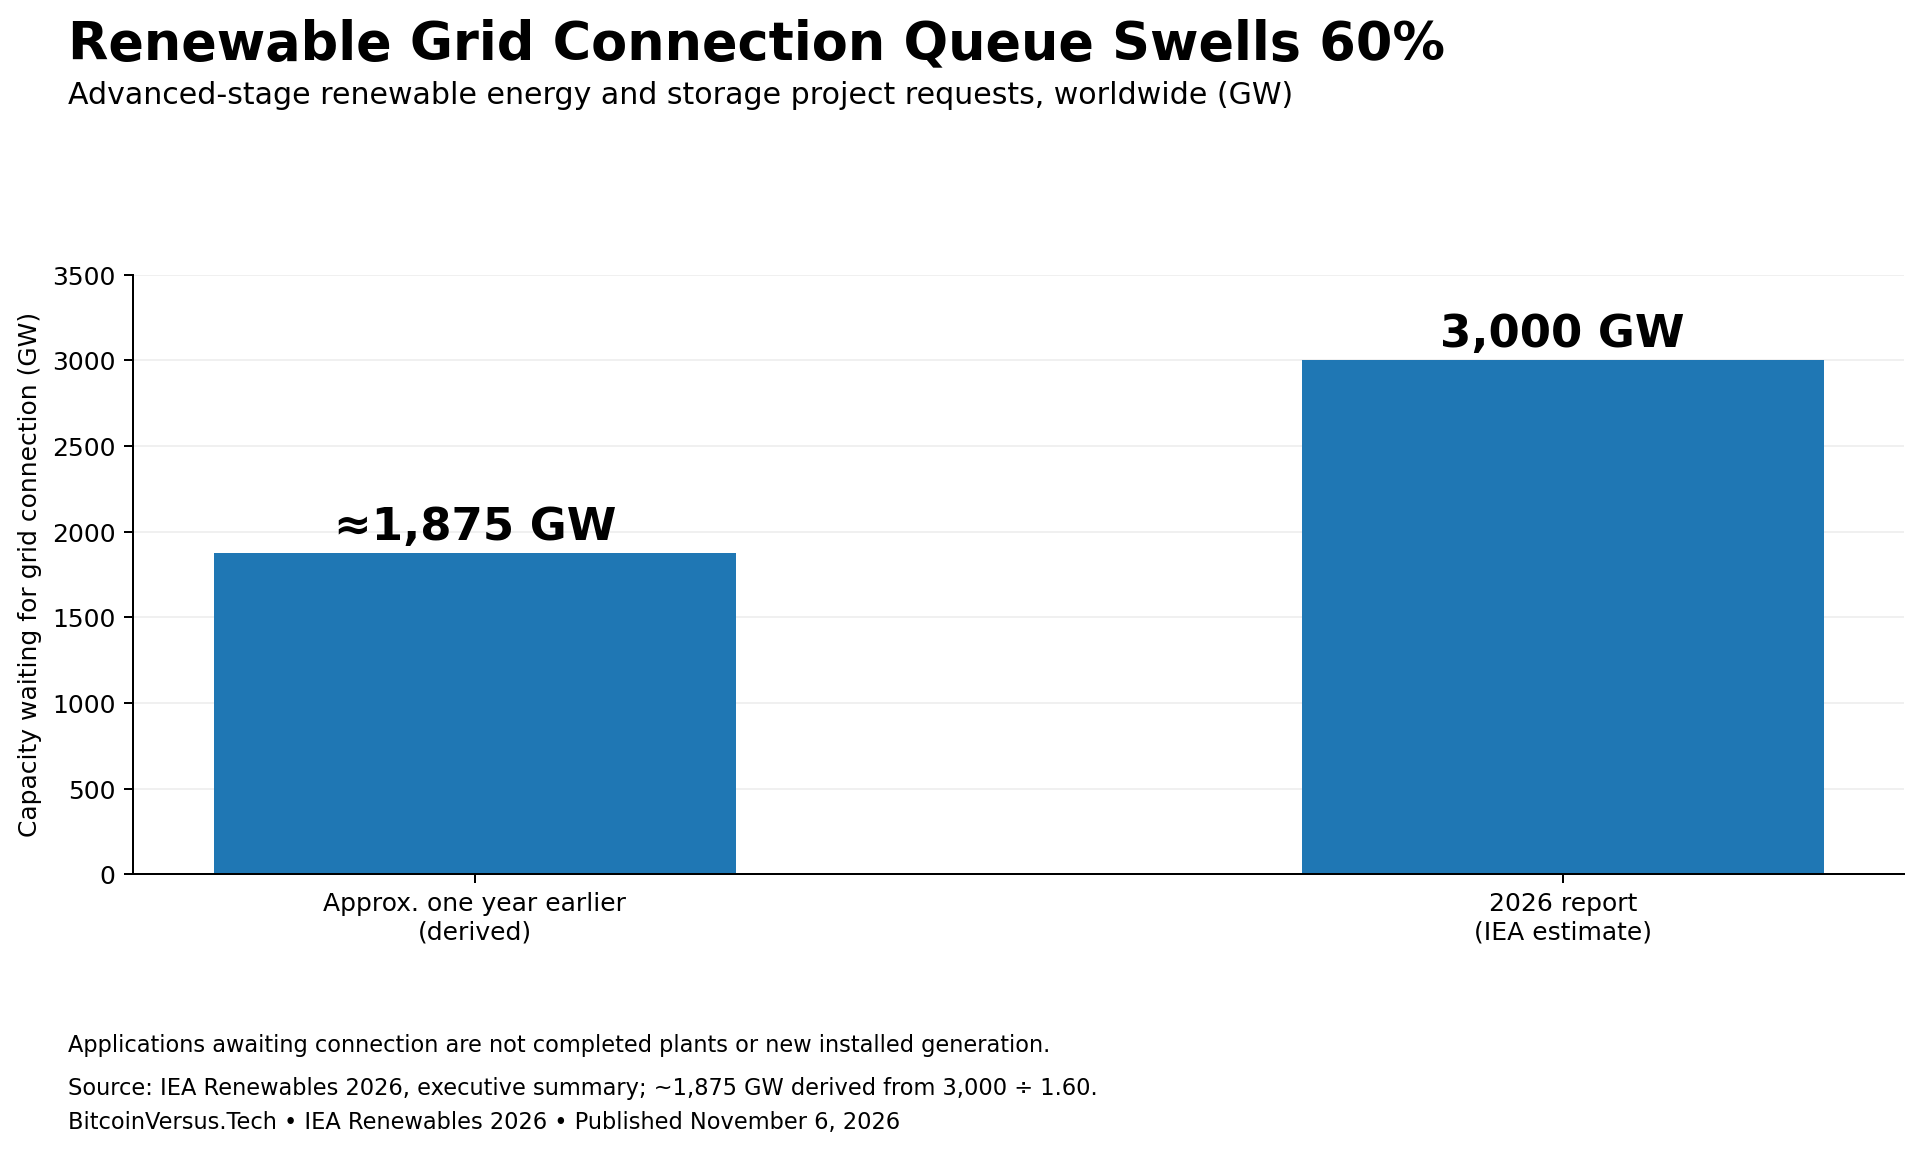
Grid construction, permitting, transmission planning, storage and demand flexibility will determine how much capacity becomes useful power. The IEA warns that wind and solar electricity curtailed in key markets could exceed 800 TWh in 2031, versus almost 200 TWh in 2025. BitcoinVersus.Tech explored why transmission approvals often take longer than solar construction and major grid investment programs.
The IEA forecasts renewable sources rising from 33% of global electricity generation in 2025 to nearly 45% by 2031. Its faster-growth scenario could approach the international target of tripling renewable capacity, but a November 6 IEA release stresses the need for dependable supply chains and electricity-network investment. The central projection remains a scenario, not a guarantee that every planned solar farm, wind turbine or grid connection will be delivered on schedule.
Editor’s Note: Figures were checked against the International Energy Agency’s November 6, 2026 Renewables 2026 executive summary, renewable-electricity chapter, and regional forecast tables. Chart 1 uses the IEA’s more-than-4,770-GW forecast and a historical estimate derived from its rounded 57% comparison. Chart 2 adds 2,075 GW of utility-scale solar to 1,530 GW of distributed solar; other technologies are an approximate remainder. Chart 3’s earlier connection-queue figure is calculated from the rounded 60% increase to 3,000 GW. All three charts were produced for BitcoinVersus.Tech; forecast capacity must not be confused with completed installations, generated electricity or projects actually connected to the grid. The cover is a conceptual editorial illustration, not a photograph of a particular renewable-energy project.

To donate 5,000 sats, open the article on a separate display and scan the original QR code with a compatible Bitcoin wallet. On mobile, use another screen or your wallet’s supported image-scanning feature. Verify the destination 3C9o19EH5HSiwEPyCTmEKzxhNCbo2X6TTb before sending.
We volunteer daily to ensure the information on this platform is Verifiably True. If you would like to support the research, please scan QR code.
BitcoinVersus.Tech is not a financial advisor. Energy-system statistics and forecasts are presented for informational purposes.


Leave a Reply