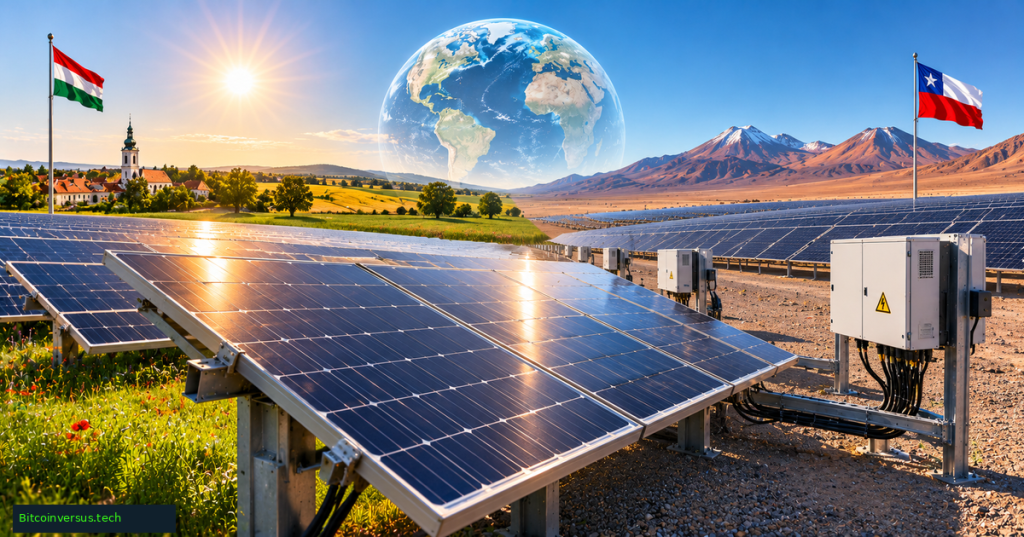
Solar panels convert sunlight into direct-current electricity, which inverters convert to alternating current for homes, industry and power grids. Countries can be ranked by how much electricity their solar installations actually generate, or by solar’s share of all electricity produced. An updated November 3, 2026, dataset from energy think tank Ember identifies Hungary and Chile as the leading large solar-producing countries by share of electricity generation in 2025.
Ember, “Global Electricity Review 2026: Asia-Pacific Session,” recorded April 21, 2026. The official presentation provides context for the underlying 2025 electricity dataset; the webinar predates Ember’s November 3 data refresh.
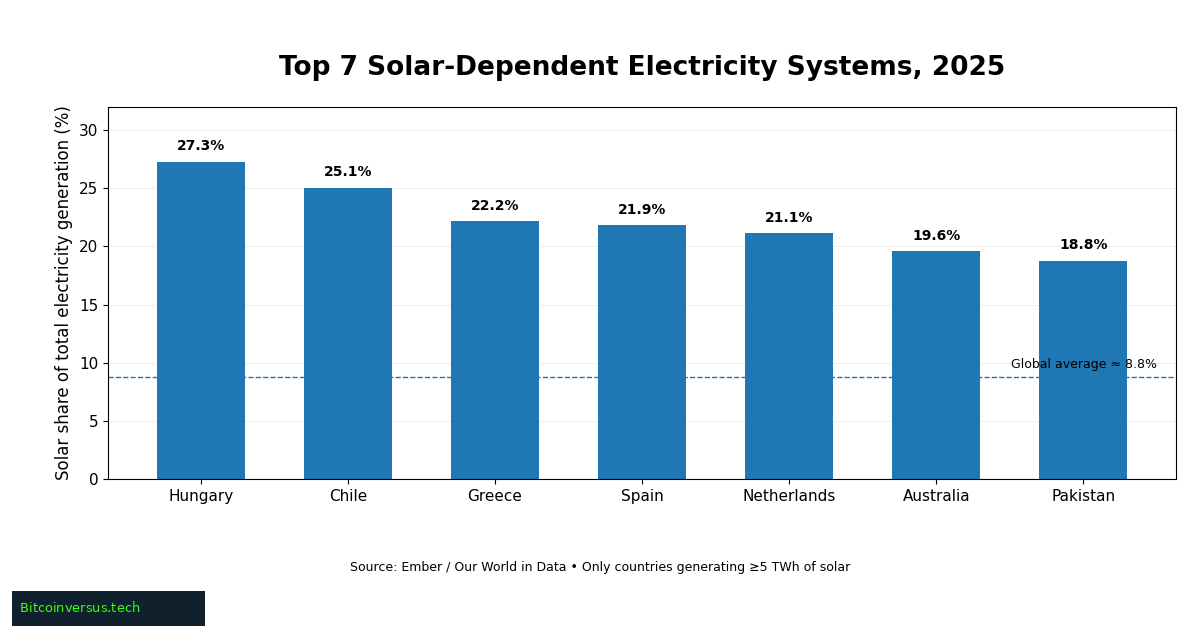
The Top Seven Solar-Share Countries
Using Ember’s 2025 country figures, the ranking includes only countries generating at least 5 terawatt-hours (TWh) of solar electricity annually. That minimum reflects Ember’s published major-market comparison and excludes small-grid countries whose larger percentages may otherwise lead an unrestricted ranking. The denominator is each country’s total domestic electricity generation, not installed solar capacity or electricity consumption.
1. Hungary — 27.29%. Hungary recorded the highest solar electricity share among the qualifying systems, climbing from roughly 24% in 2024, according to Ember. Rooftop and utility-scale investment helped solar become a major contributor to domestic production.
2. Chile — 25.06%. Chile drew just over one-quarter of generated electricity from solar. Strong desert sunlight encourages photovoltaic development, while midday oversupply and transmission bottlenecks increase the value of energy storage.
3. Greece — 22.17%. Greece ranked third, with solar contributing over one-fifth of generation. Integrating variable output requires flexibility from storage, interconnections and dispatchable generation.
4. Spain — 21.85%. Spain’s large solar fleet helped deliver a high national share despite much higher total electricity demand than Hungary. The country’s mix also includes substantial wind and other generation.
5. Netherlands — 21.12%. The Netherlands ranked fifth, reflecting extensive deployment across rooftops and commercial properties. Its high share does not imply the same annual irradiation conditions as Chile.
6. Australia — 19.59%. Rooftop systems are central to Australian solar production. Ember estimates 43% of Australian households have solar panels, and identifies the country as a per-capita solar generation leader.
7. Pakistan — 18.77%. Pakistan’s solar share rose from 6.6% in 2022 to approximately 18.8% in 2025, supported by fast distributed-solar adoption. Ember estimated an 85% increase in solar output during 2025.
A Solar Share Ranking Is Not a Production Ranking
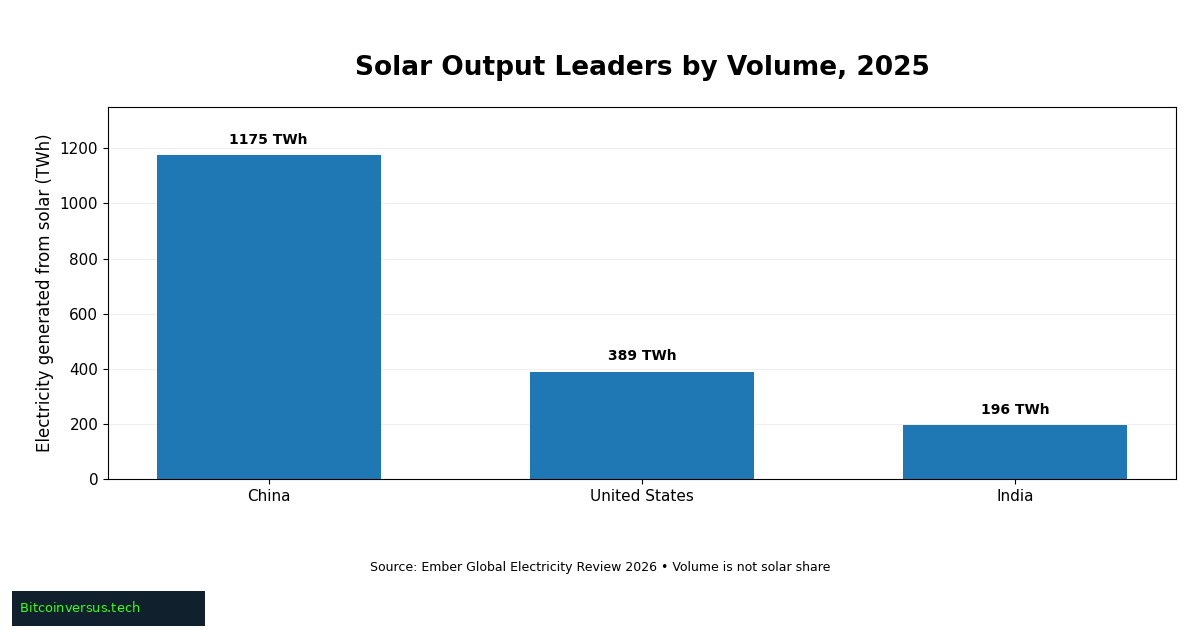
The seven ranked countries are not necessarily the world’s biggest solar electricity producers. In 2025, China generated 1,175 TWh from solar, versus 389 TWh for the United States and 196 TWh for India. China leads in volume but only about 11.1% of its national electricity came from solar. Comparing shares and TWh without identifying the denominator can produce misleading conclusions. BitcoinVersus.Tech previously examined renewable capacity growth and solar’s long-term expansion; capacity and generated energy remain distinct metrics.
Ember, “Global Electricity Review 2026: Europe & Americas Session,” April 21, 2026. Official webinar discussing global electricity trends and energy-system challenges, rather than a live November ranking announcement.
What Comes After Rapid Solar Growth
The International Energy Agency’s November 6, 2026, Renewables report projects nearly 4,800 gigawatts of new renewable-power capacity globally from 2026 through 2031, with solar photovoltaic systems contributing more than three-quarters. The outlook is a forecast rather than achieved production. Grid congestion, curtailment, electricity-market pricing and nighttime demand remain practical constraints. The role of storage is explored in the site’s battery plant ranking and grid-queue analysis.
The ranking deliberately does not claim the seven largest unrestricted national shares. Smaller electricity systems, including Luxembourg, can show higher percentages while generating under the 5 TWh solar-output threshold. Ember also revises its yearly series as national data arrive, meaning country percentages may change. Historical perspective appears in BitcoinVersus.Tech’s history of the solar industry.
Sources: Ember, Yearly Electricity Data, updated November 3, 2026; Our World in Data, 2025 solar generation shares based on Ember; Ember, 2026 Global Electricity Review; IEA, Renewables 2026, November 6.
BitcoinVersus.Tech Editor’s Note
Published November 8, 2026. The Top 7 ranking applies Ember’s 5 TWh minimum annual solar-generation criterion; it is not an unrestricted ranking of all countries. Shares use 2025 domestic electricity generation and may be revised in future Ember releases. The November 3 dataset refresh is the reporting update, while the April 2026 Ember report provides historical interpretation. The separate output chart shows TWh, not percentages. The featured cover is a conceptual illustration of Hungary and Chile, not a photograph of a named solar facility. Both videos are official Ember webinar recordings, not coverage of the November dataset refresh.
We volunteer daily to ensure the information on this platform is Verifiably True. If you would like to support the research, please scan QR code.
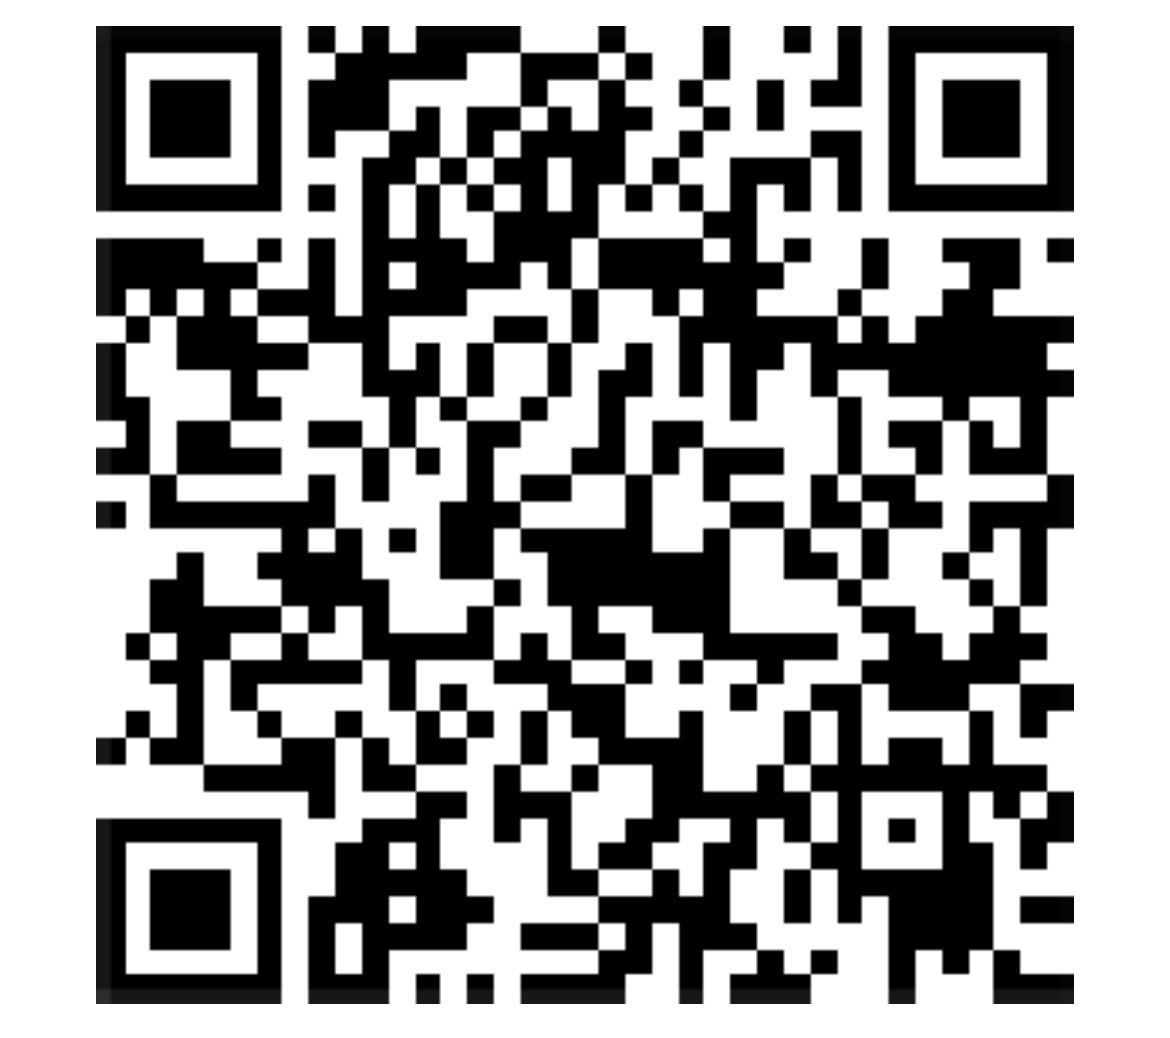
To support independent reporting, make an optional donation of 5,000 satoshis. Scan the original QR code with a Bitcoin wallet on another screen, or use a compatible saved-image scanner on mobile. Verify the destination address 3C9o19EH5HSiwEPyCTmEKzxhNCbo2X6TTb and the payment amount before sending.
BitcoinVersus.Tech is not a financial advisor. Financial coverage is provided purely for informational purposes.


Leave a Reply