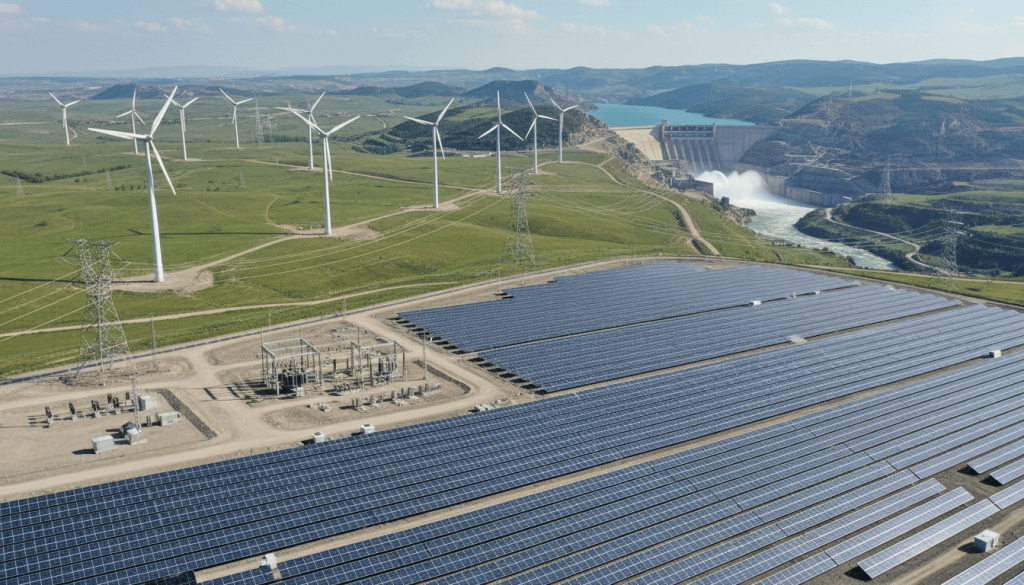
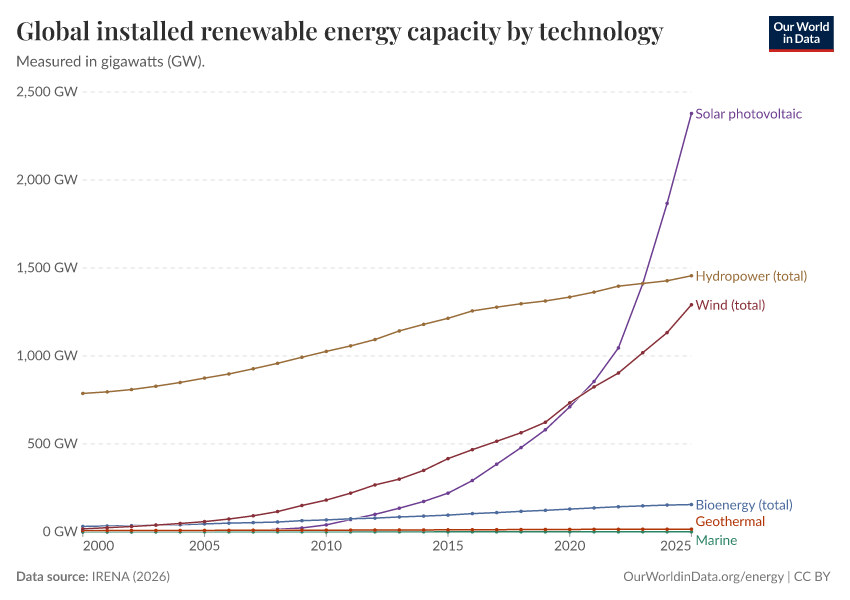
Solar power recorded the largest absolute expansion among renewable electricity technologies between 2000 and 2025, according to the International Renewable Energy Agency historical series processed by Our World in Data. Global solar generating capacity rose from approximately 1.22 gigawatts to 2,396.71 GW, an increase of about 2,395.49 GW over the 25 elapsed years spanning 26 year-end observations.
Wind energy followed, expanding from 16.96 GW in 2000 to 1,291.02 GW in 2025, or approximately 1,274.05 GW of additional installed capacity. Renewable hydropower also expanded substantially, but the speed of solar and wind installations changed the structure of the world’s power systems. The figures measure equipment rated capacity, not the electricity actually delivered annually.
Solar Leads in Gigawatts Added
Hydropower entered the century with a much larger installed base. The comparable Our World in Data renewable-hydropower category stood at 663.88 GW in 2000 and 1,234.15 GW in 2025, growing by 570.27 GW. Its slow percentage expansion reflects a mature technology, significant civil-construction requirements, geographic limitations and the environmental costs of river alterations.
Solar’s gain exceeded wind’s by roughly 1,121 GW, while wind added more than twice the comparable hydropower gain. The original IRENA publication reports slightly different year-end aggregates in some tables and editions; historical charts should keep one consistently revised series rather than mixing snapshots from different publication years.
Smaller technologies grew unevenly. Bioenergy total capacity increased from approximately 31.11 GW to 155.36 GW. Geothermal increased from 8.27 GW to 15.62 GW. Marine energy remained a negligible share of global installed capacity, despite research on tidal and wave electricity. Their technological value cannot be judged solely on nameplate capacity: availability, grid services, fuel use, environmental effects and operating costs also matter.
Absolute Growth Versus Percentage Growth
Starting from a small base makes percentage-growth rankings misleading. Solar capacity increased by more than a thousandfold, while offshore wind recorded an enormous percentage increase from an initial figure near zero. Yet absolute added gigawatts offer the clearest answer when the question is which renewable technology the world physically adopted most over the selected period.
A zero-baseline vertical bar comparison is appropriate for absolute capacity additions, while a time-series line chart better displays the multidecade trajectory. A stacked area chart usefully shows changing proportions but makes exact intermediate comparisons harder. The linked historical chart can therefore be interrogated by year, technology and scale without assigning the same meaning to capacity and energy production.
Deployment matters for rising data center electricity demand. The construction-lead-time comparison demonstrates solar’s relatively short on-site build period, but interconnection remains a separate bottleneck. U.S. solar-plus-battery projects can shift some generation between hours, while pumped-hydropower assets provide another flexibility option. Ocean-energy technology illustrates why promising physical resources do not necessarily result in rapid commercial adoption.
IRENA reported 511 GW of solar capacity additions during 2025 alone, compared with 159 GW for wind. Expansion is geographically concentrated: China, the United States and the European Union represented most renewable additions. Manufacturing scale, finance, tariffs, land availability and permitting help explain regional differences. Continued solar growth can lower installation costs but also magnify demand for transmission, storage and flexible generation.
A full accounting of all global energy types would require comparable 2000–2025 additions for coal, natural gas, oil and nuclear, plus actual generation measured in terawatt-hours. Renewable-only figures cannot prove solar surpassed every fossil technology in cumulative output. The defensible result is narrower and clear: within the matched renewable-capacity series, solar recorded the largest net gain.
Data and methodology: Our World in Data historical technology table, based on IRENA Renewable Capacity Statistics 2026. All values are global gigawatts; additions equal 2025 minus 2000 installed capacity, rather than gross construction. Technology group definitions and revisions must be retained in future SmartChart comparisons.
Editor’s Note: The 2000–2025 dataset includes 26 annual year-end observations. Global 2026 year-end totals are not yet available as of November 3, 2026. Capacity is not generation, energy storage does not create net electricity, and historical categories may differ slightly across IRENA and Our World in Data aggregations.


Leave a Reply