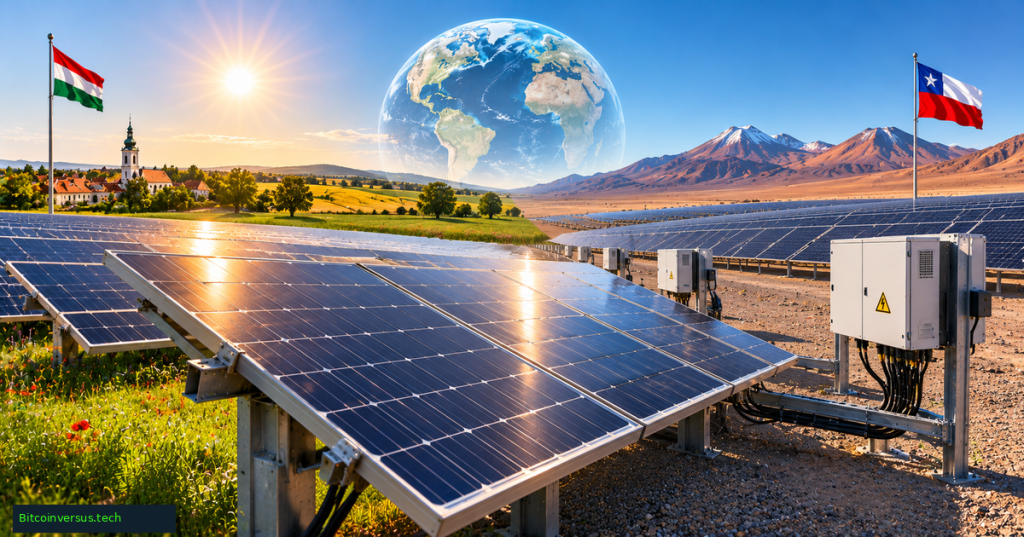
Photovoltaic panels convert sunlight into direct-current electricity, which an inverter changes into alternating current for buildings and power networks. A country’s solar generation share measures electricity produced by solar divided by electricity generated from all sources during the same period. Under an analysis of Ember’s regularly updated annual electricity dataset, seven major solar-producing countries supplied at least 18.8% of their reported electricity generation from solar in 2025.
Ember, “Global Electricity Review 2026: Asia-Pacific Session,” April 21, 2026. Official analyst presentation explaining the 2025 global electricity findings; the recording predates the November dataset refresh.
The ranking covers countries producing at least 5 terawatt-hours (TWh) of solar electricity annually, following the large-market filter in Ember’s 2026 Global Electricity Review. Smaller electricity systems, including countries with potentially higher solar percentages, are intentionally excluded. The underlying 2025 figures were published in April, while Ember lists a further dataset refresh on November 3, 2026. The ranking therefore concerns annual generation, not the instantaneous output or solar capacity on November 8.
Top 7 by share of electricity generated
- Hungary — 27.3% — The leader reached 27.29%, up from approximately 24% in 2024. Solar farms and rooftop generation now account for more than one-quarter of annual electricity output.
- Chile — 25.1% — Chile’s 25.06% share places it second. Extensive desert solar development has raised daytime supplies while increasing the need for storage and grid flexibility.
- Greece — 22.2% — At 22.17%, Greece illustrates substantial solar penetration in a Mediterranean electricity system, with growing importance for interconnections and flexible dispatch.
- Spain — 21.9% — Spain generated 21.85% of its electricity from solar. The result complements the country’s large absolute output, about 63 TWh in Ember’s global review.
- Netherlands — 21.1% — Despite less intense sunlight than many southern markets, Dutch rooftops and other installations delivered a 21.12% solar share.
- Australia — 19.6% — Australia reached 19.59% and led globally in solar electricity produced per resident, according to Ember. Widespread household panels are a major factor.
- Pakistan — 18.8% — Pakistan reached 18.77% in the reported electricity mix after rapid solar adoption. Ember notes that off-grid and behind-the-meter production complicates complete measurement.
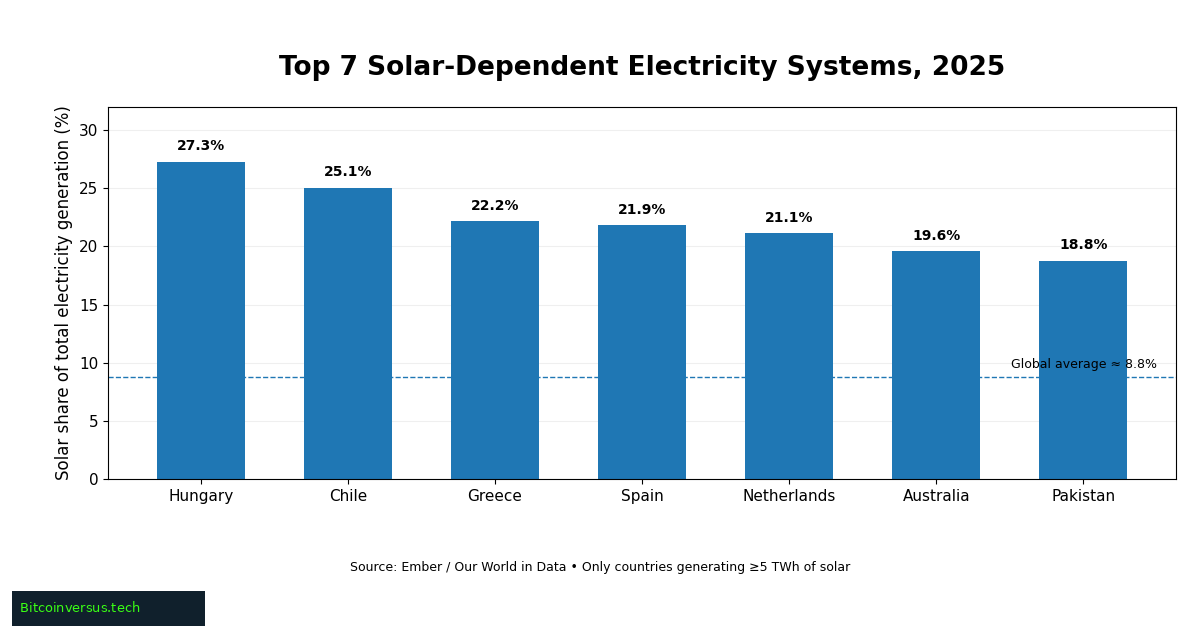
Hungary’s share of 27.3% is about 3.1 times the global solar share of roughly 8.8%. Ember reported 50 countries above 10% solar in 2025, compared with 15 in 2020. The rapid expansion builds on the longer-term trends reviewed in BitcoinVersus.Tech’s 26-year renewable-capacity analysis. Installed gigawatts, however, are not the same measurement as terawatt-hours generated.
Ember, “Global Electricity Review 2026: Europe & Americas Session,” April 21, 2026. Official webinar featuring electricity analysts and solar-industry specialists; contextual research presentation rather than footage of a particular plant.
A different winner when ranking total electricity
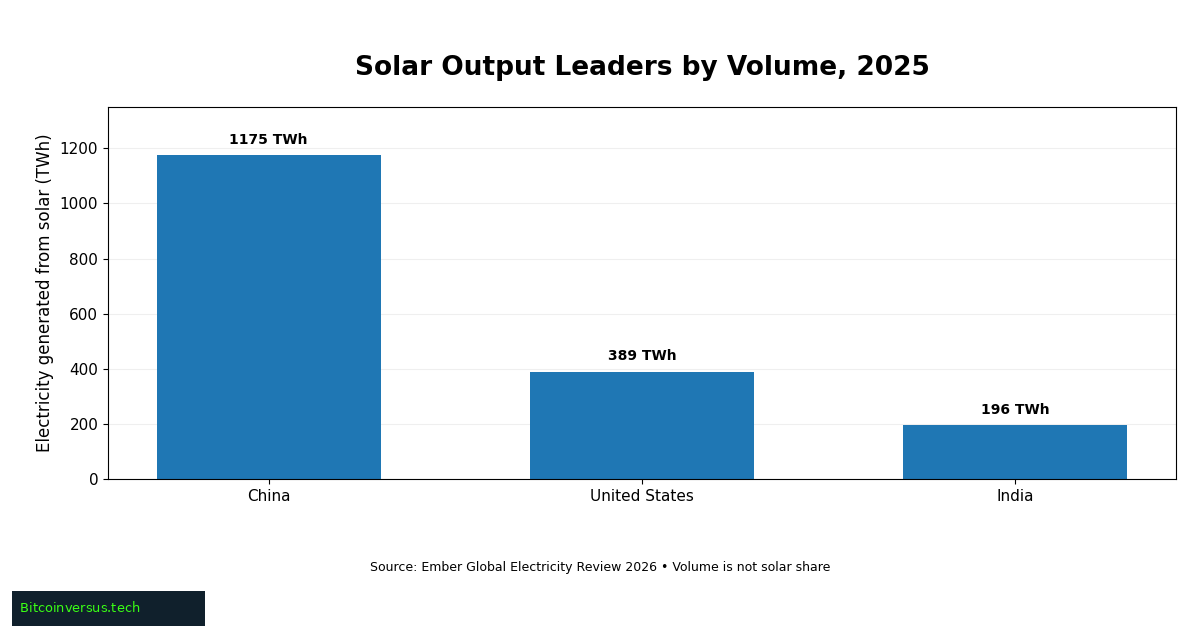
Solar share and production volume answer different questions. China produced approximately 1,175 TWh of solar power in 2025, followed by the United States at 389 TWh and India at 196 TWh. None topped the seven-country share list. Their much larger national electricity systems dilute solar’s percentage even when absolute production is substantial. Related capacity figures appear in the IRENA-based capacity-growth comparison.
Why solar leaders increasingly need storage
Large midday output can push prices down and create congestion or curtailment if demand and transmission cannot absorb available electricity. Ember estimates Chile added enough battery capacity in 2025 to theoretically shift 76% of its added daily solar generation, while Australia reached 53%. Actual batteries also provide grid services beyond shifting sunlight. BitcoinVersus.Tech has examined solar farms adding batteries and large operating battery sites.
The IEA’s renewable-growth outlook shows why expanding grids matters alongside panel manufacturing. Solar-generation statistics may be revised, and distributed or off-grid production can be incompletely counted. The leading percentages measure recorded annual supply, not reliability, total carbon emissions, or the ability to run entirely on solar after sunset.
Primary references: Ember, Global Electricity Review 2026, generation trends; Ember, Yearly Electricity Data, refreshed November 3; Our World in Data, Ember-derived annual solar shares; and Ember, battery and grid integration analysis.
BitcoinVersus.Tech Editor’s Note
Published November 8, 2026. Rankings use 2025 annual electricity generation, limited to countries producing at least 5 TWh of solar electricity. Percentages are rounded from Ember-derived annual data; the global benchmark is approximate. The November 3 dataset refresh is not a new 2026 full-year ranking. The featured solar landscape is conceptual artwork depicting Hungary and Chile, not verified photographs of named plants. Both Ember webinars are original 2026 presentations provided for research context. In-story charts are original visualizations and are separate from the featured image.
We volunteer daily to ensure the information on this platform is Verifiably True. If you would like to support the research, please scan QR code.

Support independent research with an optional donation of 5,000 satoshis. Scan the original QR using a Bitcoin wallet from a separate screen, or use a compatible saved-image scanner on mobile. Verify the address 3C9o19EH5HSiwEPyCTmEKzxhNCbo2X6TTb and amount before payment.
BitcoinVersus.Tech is not a financial advisor. Financial coverage is provided purely for informational purposes.


Leave a Reply