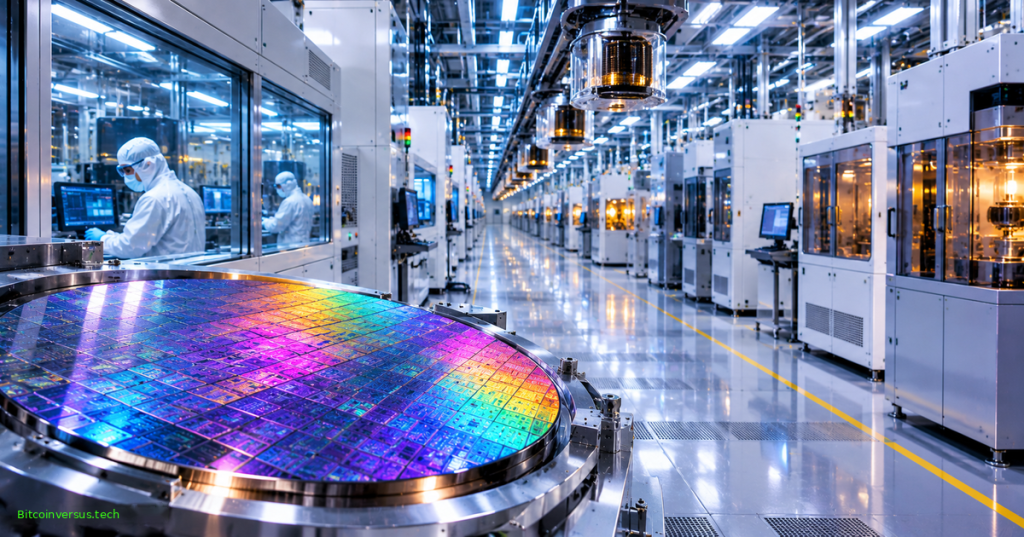
Semiconductor foundries manufacture integrated circuits designed by customers, converting silicon wafers into processors, communications chips and power-management devices. Their revenue depends on wafer volume, manufacturing complexity, product mix and pricing—not simply the number of chips produced. In its September 9, 2026 report, TrendForce ranked the world’s largest foundries using second-quarter foundry revenue. TSMC dominated the ranking, earning more than 12 times the revenue of second-place Samsung Foundry.
TSMC Museum of Innovation, “TSMC Fab Tour” (February 22, 2024). Official footage explains wafer fabrication; the earlier tour does not document individual companies’ 2026 revenue.
The revenue ranking
TrendForce estimated that the industry’s top 10 foundries generated $53.488 billion in Q2 2026, up 11.5% quarter over quarter. The following seven ranks use the same April–June reporting period, with values expressed in U.S. dollars. The September release supplies the latest complete comparable ranking available as of November 8; preliminary third-quarter company disclosures are not a complete replacement.
1. TSMC — $40.198 billion
TSMC controlled an estimated 72.5% of global foundry revenue. AI processors, advanced 3nm and 5/4nm manufacturing, and early 2nm sales supported a 12.1% quarterly revenue rise. Its market position provides context for BitcoinVersus.Tech’s coverage of TSMC’s later record earnings.
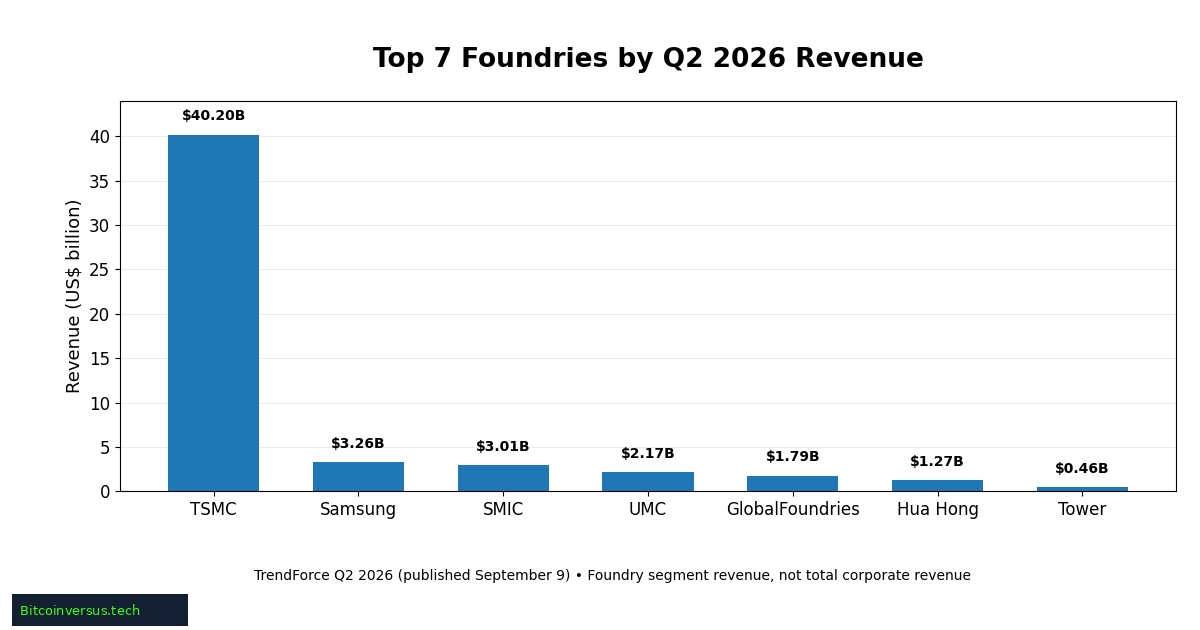
2. Samsung Foundry — $3.260 billion
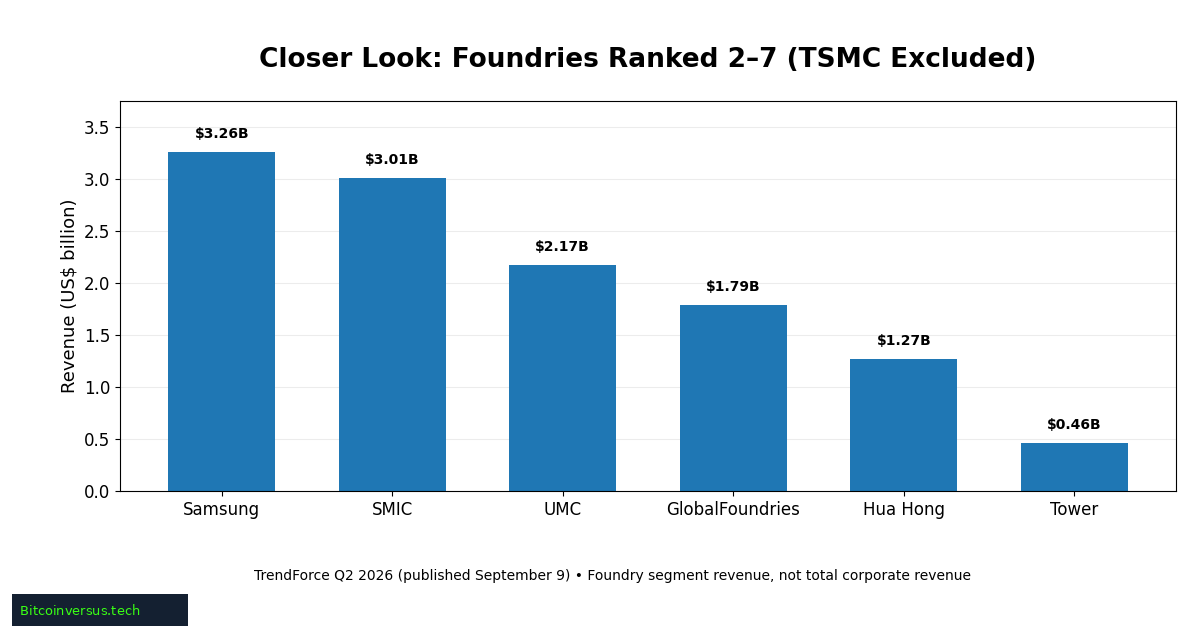
Samsung Foundry held 5.9% market share, down from 6.5% in the preceding quarter. Advanced-node orders and high-bandwidth-memory base dies supported revenue, but its 1.8% quarterly growth lagged rivals.
3. SMIC — $3.006 billion
SMIC reached 5.4% global share after revenue increased 20% quarter over quarter. PC replenishment, server networking and AI peripheral chips supported growth. The gap with Samsung narrowed to just $254 million, although advanced-process capabilities differ.
ASML, “Holistic lithography: Optimizing chipmaking from design to mass production” (June 23, 2026). Official manufacturing explainer describes lithography, metrology and process control; no comparative foundry-revenue figures are presented in the video.
4. UMC — $2.175 billion
United Microelectronics Corporation retained fourth place with 3.9% market share. Demand for consumer products and server-related chips, together with improved 8-inch wafer utilization, helped quarterly revenue rise 12.7%.
5. GlobalFoundries — $1.786 billion
GlobalFoundries earned 3.2% share, benefiting from communications and power devices. Higher wafer shipments and average selling prices lifted revenue by 9.3%. Its capacity strategy is covered in the New York fabrication expansion report.
6. Hua Hong Group — $1.274 billion
Hua Hong Group gained 3.5% sequentially, taking 2.3% share. NOR Flash, power-management IC orders and additional capacity supported its mature-process business.
7. Tower Semiconductor — $460 million
Tower Semiconductor grew 11.2% quarterly and held roughly 0.8% share. Photonic ICs and drivers for AI optical transceivers supported demand, connecting with Tower’s Japanese optical-chip expansion.
What foundry revenue does not show
Foundry sales are not total corporate sales, chip output, transistor count or fab capacity. Samsung’s foundry segment, for example, must be distinguished from its memory operations. Price and advanced-node mix can lift revenue without equivalent growth in wafer starts. The geographic implications connect to the chip-fabrication capacity outlook and manufacturing equipment investment.
TrendForce’s top 10 represented 96.5% of estimated global foundry revenue. The remaining market includes smaller providers; the ranking is therefore not an inventory of every chipmaker. Semiconductor packaging, covered in the advanced-packaging investment analysis, is a related but different revenue category.
Sources: TrendForce’s September 9 foundry ranking; TrendForce Q2 research summary; Counterpoint’s Q2 market-share study; and Evertiq’s published revenue table. Figures are estimates rounded to the reported precision.
BitcoinVersus.Tech Editor’s Note
Published November 8, 2026. Rankings and revenue figures use the second quarter of 2026, rather than mixing incomplete third-quarter disclosures. TrendForce is the ranking source; Counterpoint provides independent share context. Original chart values are in U.S. dollars, and all bars run vertically from zero. The featured cover is conceptual cleanroom artwork, not an image of a named foundry facility. The TSMC and ASML videos explain manufacturing processes, not financial results.
We volunteer daily to ensure the information on this platform is Verifiably True. If you would like to support the research, please scan QR code.

Support independent research with an optional 5,000-satoshi donation. Scan the original QR using a Bitcoin wallet on another device, or use a compatible saved-image scanner on mobile. Verify the destination address 3C9o19EH5HSiwEPyCTmEKzxhNCbo2X6TTb and amount before sending.
BitcoinVersus.Tech is not a financial advisor. Financial coverage is provided purely for informational purposes.


Leave a Reply