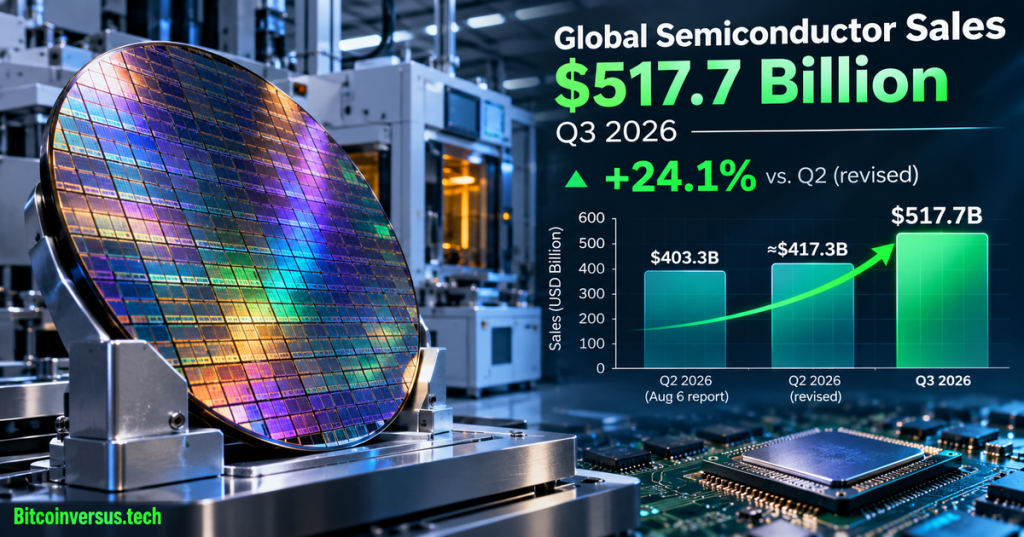
Worldwide semiconductor sales reached $517.7 billion in the third quarter of 2026, up 24.1% from the previous quarter, the Semiconductor Industry Association (SIA) reported November 3. Yet a comparison with SIA’s August release reveals a material reporting-base difference: the earlier Q2 total was $403.3 billion, while the newer data imply approximately $417.3 billion for the same period. The distinction changes the growth calculation by roughly 4.3 percentage points.
A previous BitcoinVersus.Tech report covered the September surge and its regional percentages. The new finding is the cross-release reconciliation and a breakdown of which markets contributed the most additional sales.
Official Semiconductor Industry Association webinar, “Powering AI: The Semiconductor Ecosystem at the Foundation of Data Centers,” June 2, 2026. Technical background recorded before the September sales data; not a video of the November 3 report. Credit: SIA / official YouTube.
Two official releases, two Q2 baselines
SIA’s August 6 announcement reported Q2 sales of $403.3 billion and a June three-month moving average of $134.5 billion. In the September market table published in November, the corresponding April–June rolling average is $139.11 billion. Multiplying by three gives an implied quarter of $417.33 billion, about $14.03 billion or 3.48% above the earlier Q2 figure.
The November table places the July–September average at $172.58 billion. Multiplication yields $517.74 billion, matching the rounded $517.7 billion release. Comparing like-for-like figures gives (172.58 ÷ 139.11 − 1) × 100 = 24.06%, rounded to 24.1%. Comparing Q3 against the previously announced $403.3 billion instead produces approximately 28.4%. Neither press release itemizes the underlying adjustment; a data revision is a possible explanation, not independently confirmed causation.
The Americas supply almost half the increase
Using both periods from the same September table avoids mixing vintages. Across the five SIA markets, the implied increase totals $100.41 billion for Q3 versus Q2, subject to source rounding. The Americas contribute $45.96 billion, or 45.8% of the gain. Asia Pacific/All Other adds $28.41 billion (28.3%), followed by China with $16.32 billion (16.3%), Europe with $5.25 billion (5.2%) and Japan with $4.47 billion (4.5%). The first two regions together account for approximately 74% of the increase.
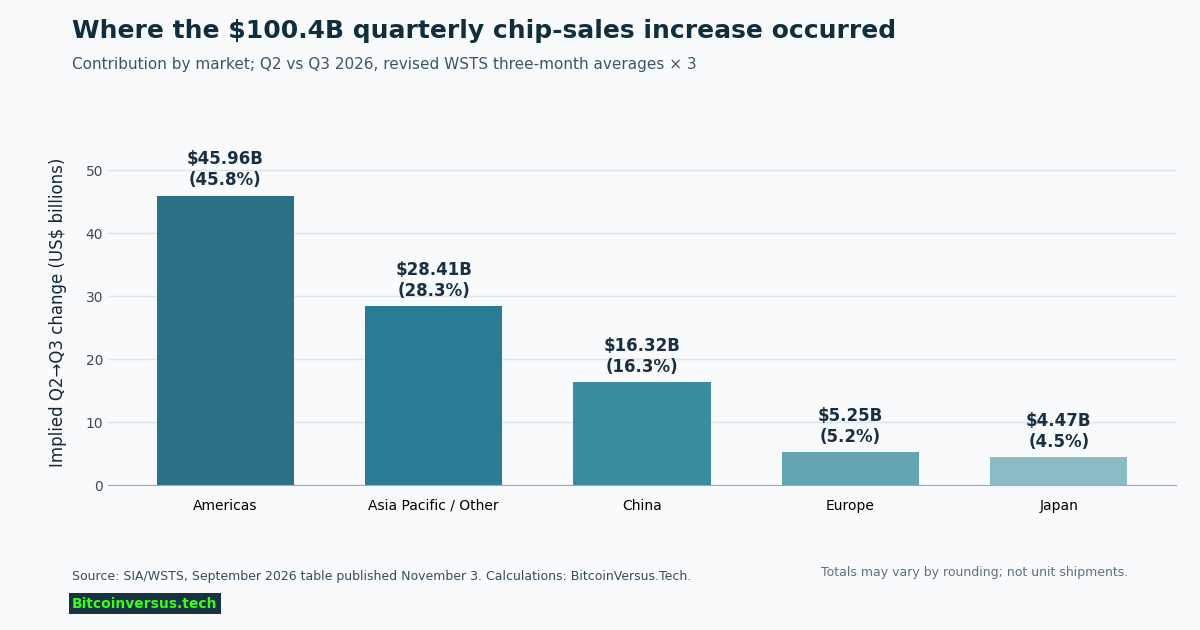
Those categories identify markets for semiconductor sales, not the geographic locations of fabrication plants. A processor designed in the United States, manufactured in Taiwan and shipped to a customer in another market cannot be assigned a production origin using sales-region totals alone. For industrial context, see our coverage of semiconductor foundry revenue and silicon wafer shipment growth.
Annual gains are broader—but not all AI demand
The September rolling monthly measure reached $172.58 billion, compared with $69.93 billion one year earlier, a 146.8% year-over-year increase. All five geographic markets posted gains, including 191.7% in the Americas, 141.4% in Asia Pacific/All Other and 124.9% in China. The comparison measures dollar revenue rather than the number of integrated circuits delivered.
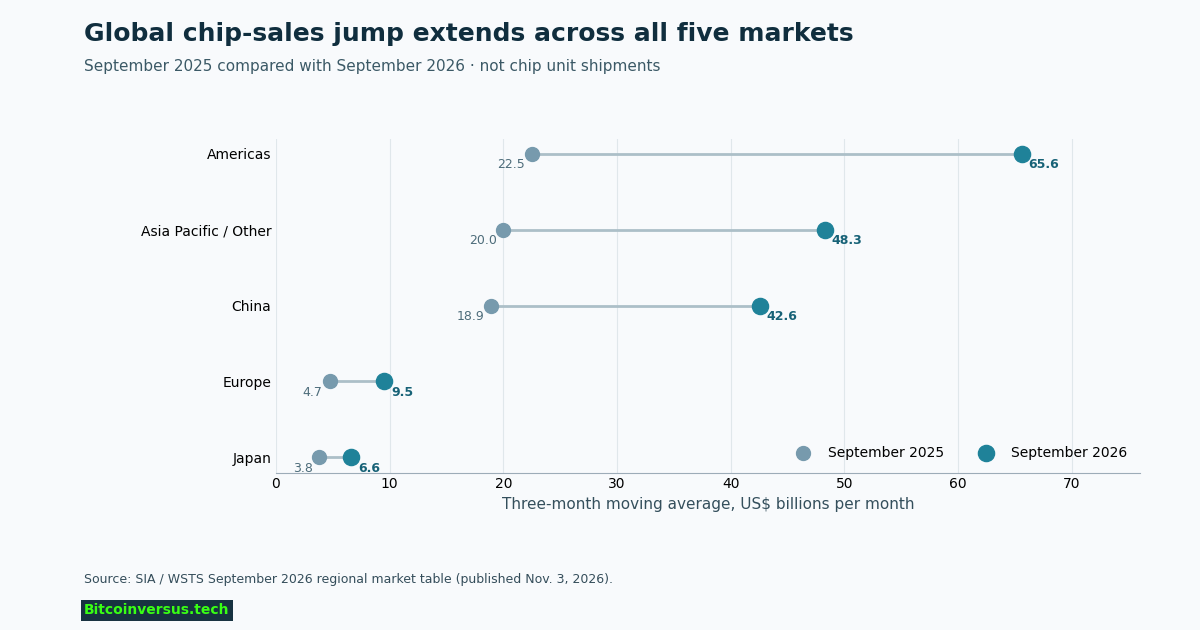
Dollar sales can rise through a combination of chip volumes, higher average selling prices and a shift toward more expensive products. The SIA aggregate cannot establish how much growth came specifically from AI accelerators, memory or other product categories. Company-level reports show contrasting business conditions: Astera Labs reported rising AI networking revenue, while Qualcomm’s handsets business contracted despite automotive gains. Such examples establish market diversity, not a decomposition of WSTS totals.
The strongest supported conclusion is simultaneous regional revenue expansion at a scale substantially above the prior year, with a comparison-base adjustment demanding careful interpretation. Further WSTS category-level shipment and pricing data would be needed to identify the sources of the surge more precisely.
Sources and calculations
SIA November 3 Q3 release; SIA September regional market table; SIA August 6 Q2 release; SIA June 2 webinar page. Quarterly comparisons derived from published rounded moving-average figures; $417.33 billion and regional absolute contributions are calculations rather than separately disclosed revised quarterly sales totals.
Editor’s Note: Reviewed November 10, 2026. The new Q2 baseline is inferred from SIA’s September WSTS table; the release does not document a formal restatement or identify the cause of the gap with the August release. The cover is an original AI-generated editorial illustration, not a photograph of a specific fab or wafer. Two in-story charts are original source-backed calculations. The official SIA webinar predates the Q3 results. Media embed code does not by itself establish video playback. BitcoinVersus.Tech provides educational reporting, not investment advice.
Support BitcoinVersus.Tech
Readers may support independent analysis with an optional 5,000-satoshi contribution. Scan the approved QR code using a compatible Bitcoin wallet. On a phone, display the code on a second device or use the wallet’s saved-image scan feature, where supported. Check the receiving address and amount before authorizing payment.

We volunteer daily to ensure the information on this platform is Verifiably True. If you would like to support the research, please scan QR code.


Leave a Reply