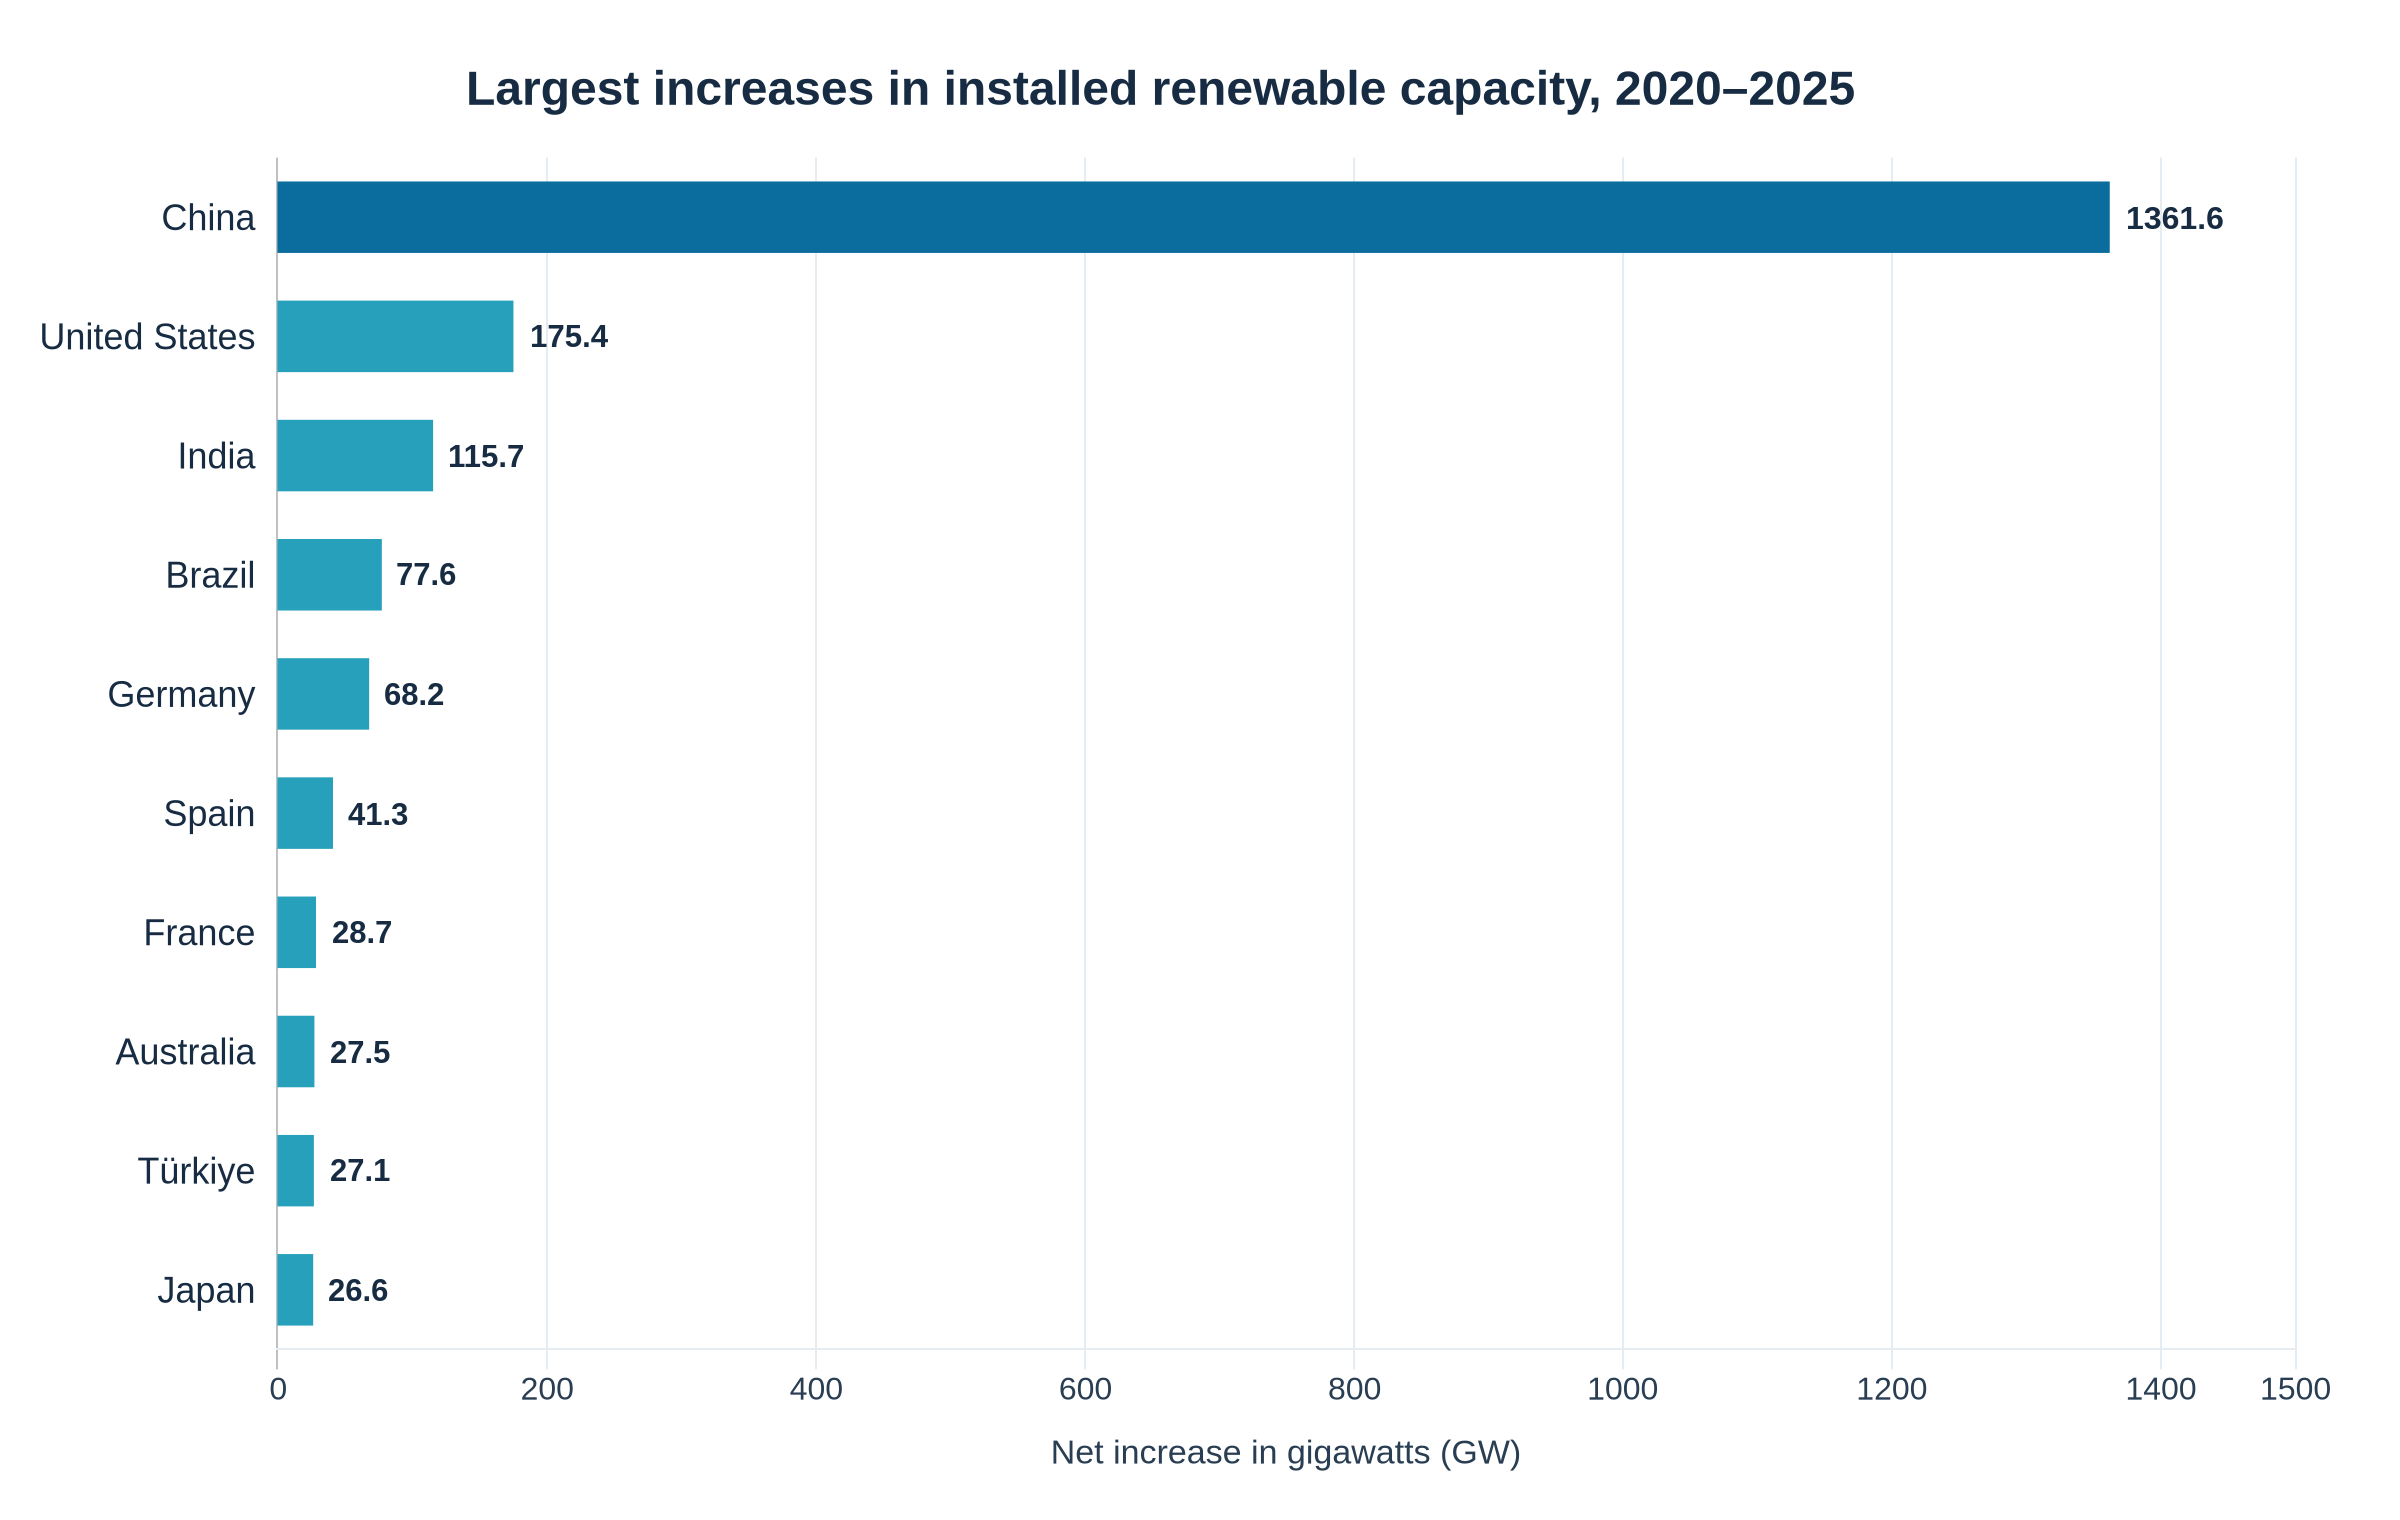
China added more renewable electricity-generating capacity than any other country from the end of 2020 through 2025, with a net increase of 1,361.6 gigawatts (GW). The United States followed at 175.4 GW, and India ranked third at 115.7 GW, according to a BitcoinVersus.Tech analysis of the International Renewable Energy Agency’s (IRENA) 2026 country statistics. Figures cover installed renewable generating capacity, not announced construction plans or additions from every kind of power plant.
A power plant’s installed capacity describes its rated maximum electrical output. One gigawatt equals 1,000 megawatts. Capacity is not electricity production: a one-gigawatt solar installation does not continuously generate one gigawatt during night, cloud cover or curtailment. Energy produced over time is measured in gigawatt-hours (GWh) or terawatt-hours (TWh), not simply GW.
China dominates the five-year ranking
China’s renewable power capacity grew from 896.4 GW at the end of 2020 to 2,258.0 GW at the end of 2025. The United States increased from 292.5 GW to 467.9 GW, while India grew from 134.8 GW to 250.5 GW. Brazil ranked fourth, adding 77.6 GW, followed by Germany with 68.2 GW.
Spain placed sixth at 41.3 GW, followed by France at 28.7 GW, Australia at 27.5 GW, Türkiye at 27.1 GW and Japan at 26.6 GW. Poland closely followed with 26.3 GW. The European Union is not ranked separately because its member states already appear as individual countries. Each value is the difference between year-end 2025 and year-end 2020 totals, after rounding IRENA’s original megawatt figures.
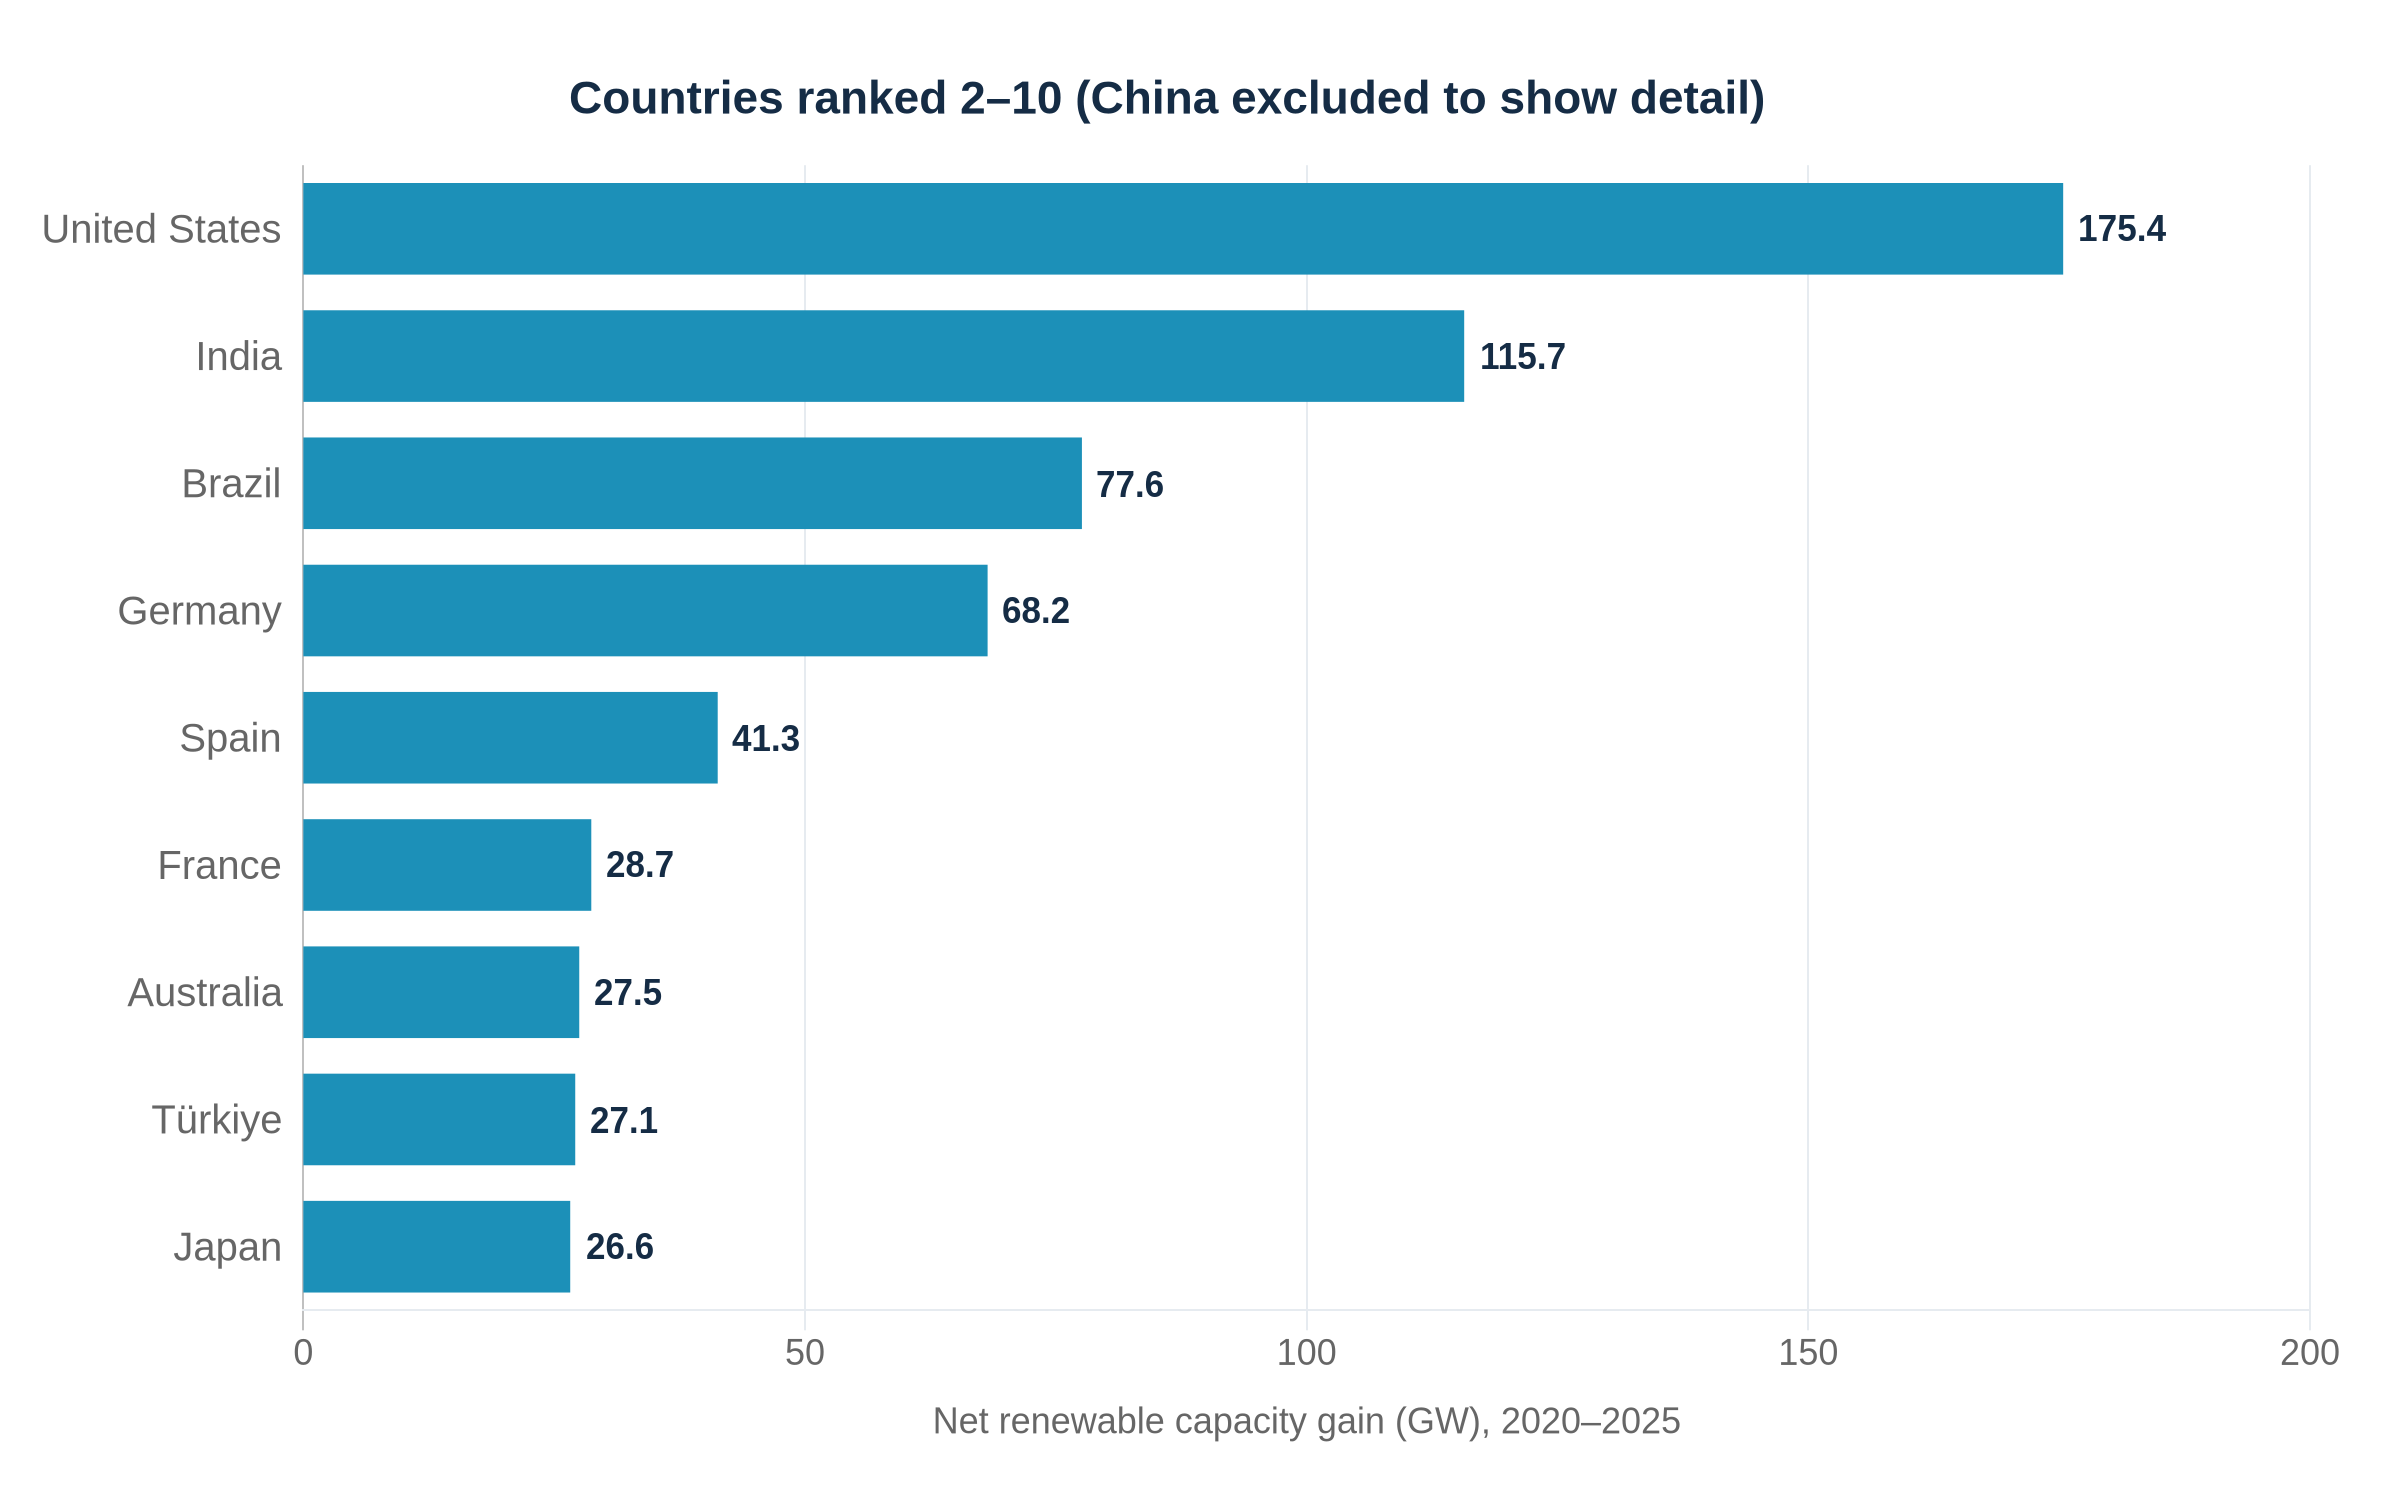
China alone represented about 58.2% of the worldwide net gain in renewable capacity over the five years. The United States accounted for approximately 7.5% and India for about 5.0%. The five leading countries together contributed nearly 77% of global net expansion. The country figures add geographic detail to BitcoinVersus.Tech’s earlier review of solar’s growing share of worldwide renewable capacity.
China’s National Energy Administration separately reported more than 430 GW of new wind and solar installations in 2025. Chinese national figures and IRENA statistics employ different reporting boundaries in some categories, so the annual announcement cannot simply be added to or substituted for IRENA’s five-year net totals.
Worldwide additions accelerate through 2025
Global installed renewable capacity rose from 2,810.9 GW at the end of 2020 to 5,149.3 GW at the end of 2025: a net increase of 2,338.4 GW. The annual gains were 266.2 GW in 2021, 302.3 GW in 2022, 493.4 GW in 2023, 584.5 GW in 2024 and 691.9 GW in 2025. Solar represented roughly 510 GW of the final year’s increase; wind contributed approximately 159 GW.
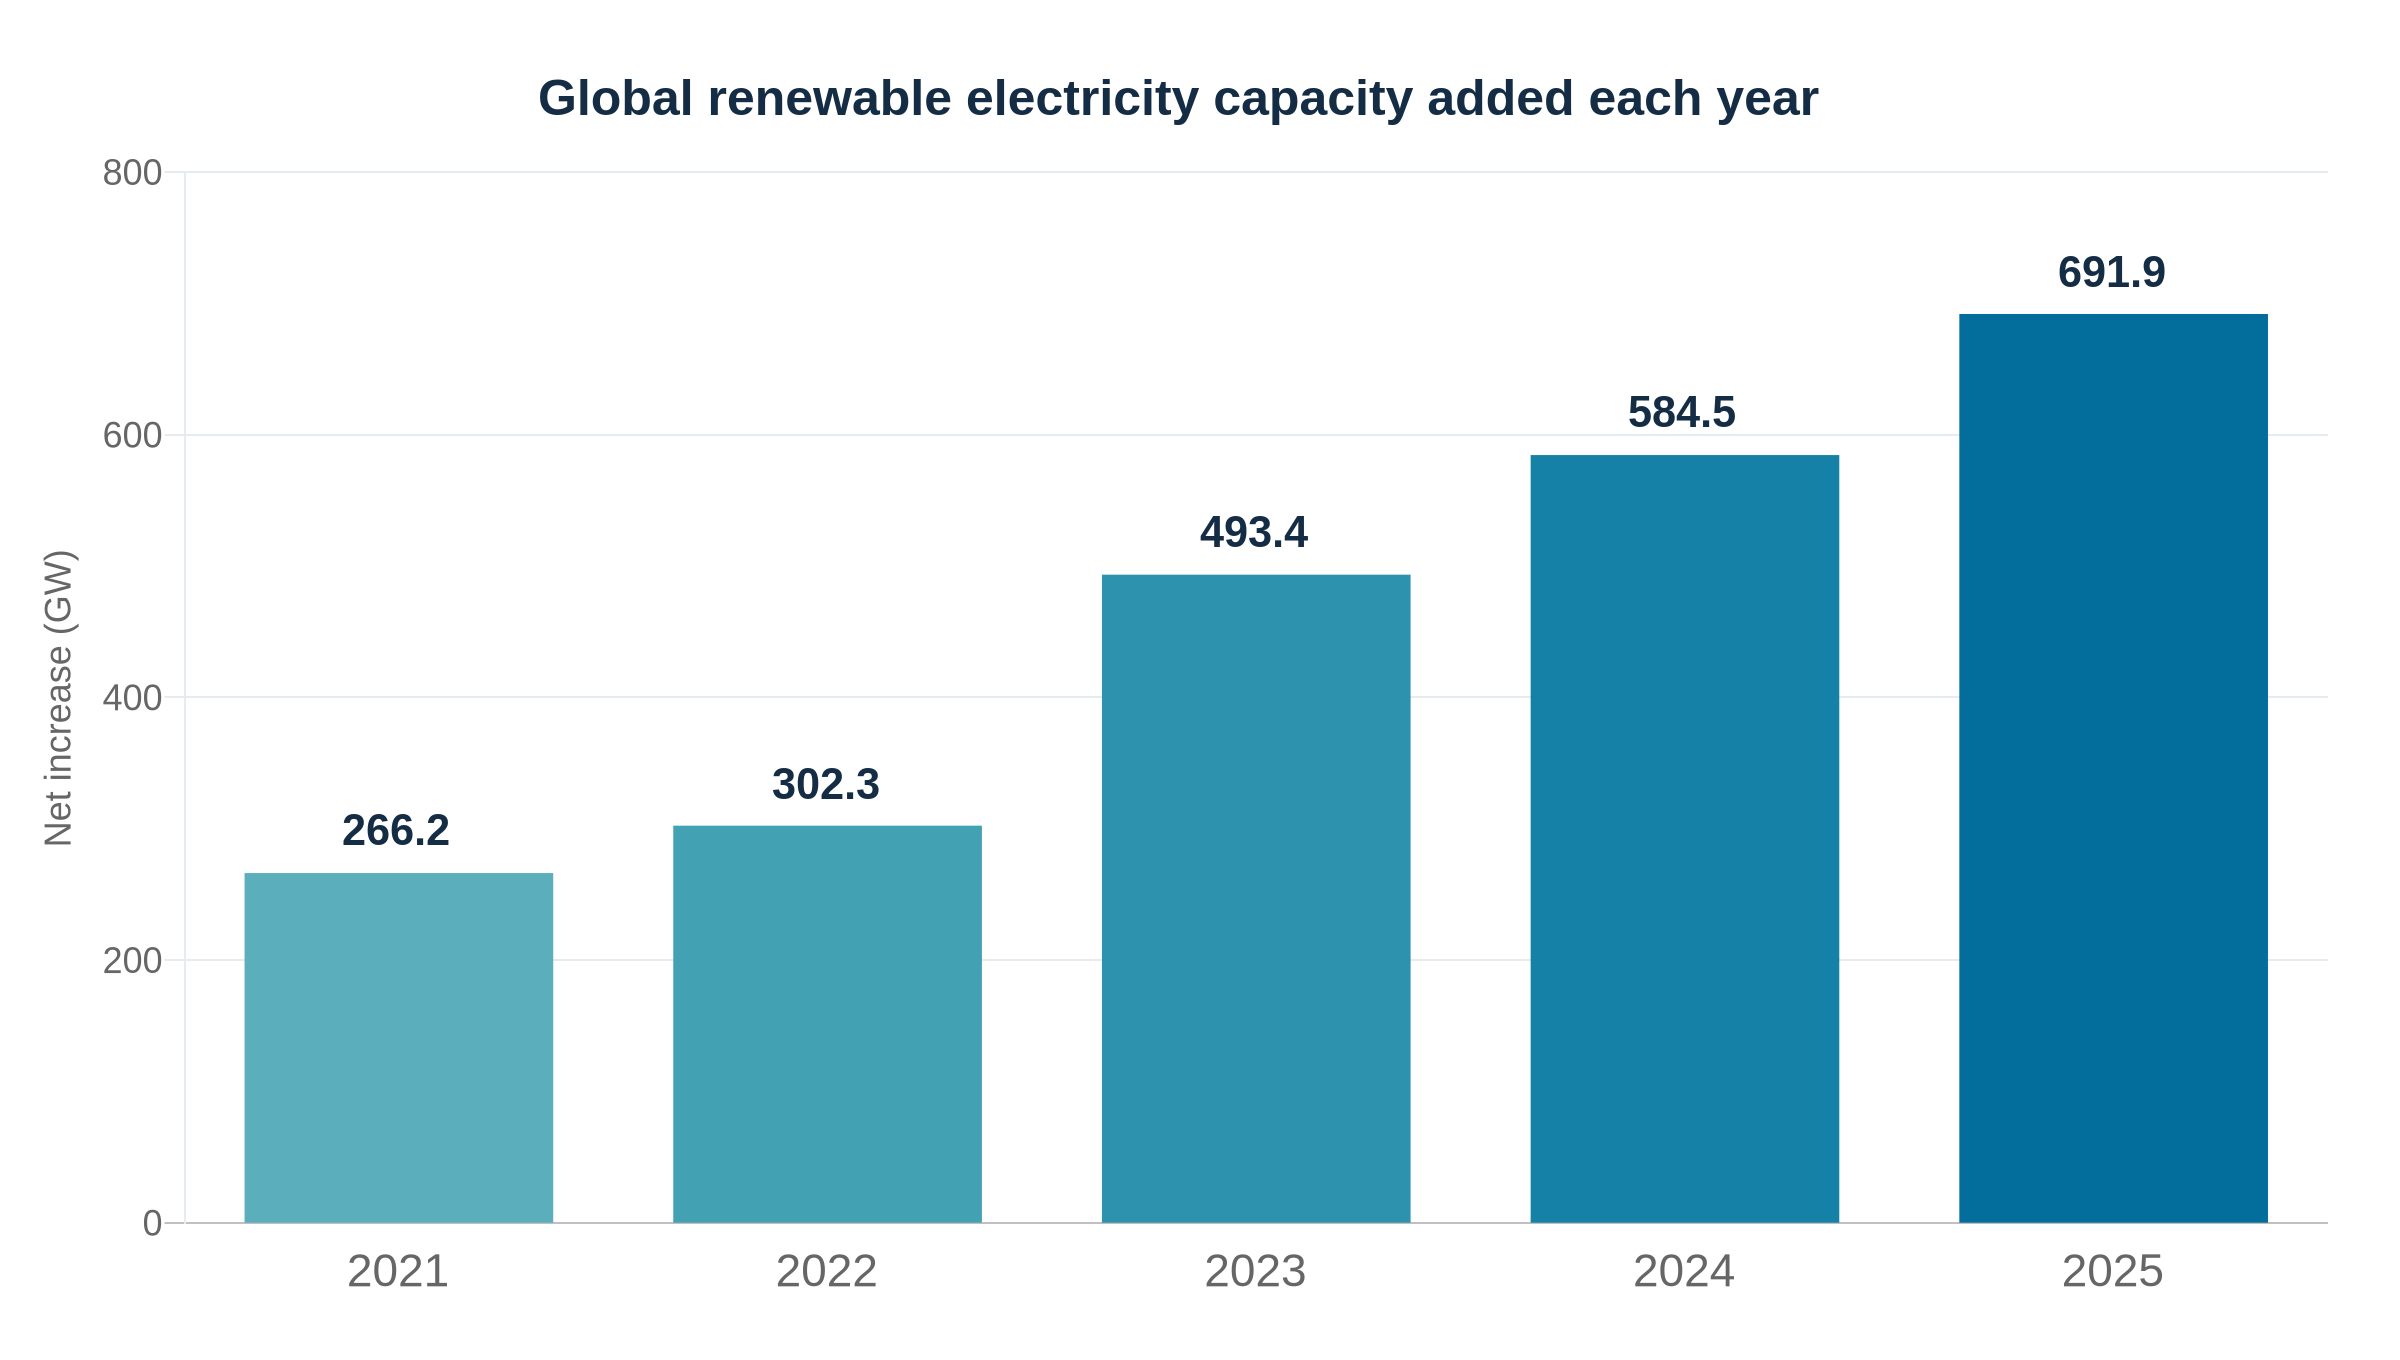
IRENA reports that renewable sources made up 85.6% of total worldwide net power-capacity growth during 2025. Rapid deployment nevertheless creates additional requirements for substations, transformers, transmission lines and grid flexibility. BitcoinVersus.Tech previously examined how interconnection work can take longer than solar construction, a constraint particularly relevant to energy-intensive computing and industrial expansion.
Installed capacity and reliable supply are different measures
The ranking should not be confused with dependable generating capability during peak demand. Wind varies by weather, solar by daylight, and hydropower by water availability. Storage, reserve generation and long-distance transmission can improve grid reliability, but their capabilities must be evaluated separately from generation nameplate ratings.
BitcoinVersus.Tech’s reporting on storage accompanying American solar farms illustrates the distinction between electrical power and stored energy. Batteries are rated in MW for power and MWh for energy. A storage system rated at 500 MW and 1,000 MWh could theoretically deliver its full output for two hours before accounting for losses and operational reserves.
Power systems can therefore expand renewables while planning conventional supply. Germany’s gas-power capacity contracts demonstrate how dispatchable resources can remain relevant alongside wind and solar expansion. Operational planning requires hourly generation, reserves and grid constraints rather than nameplate capacity alone.
What the national comparison excludes
The figures represent net changes in installed renewable generating capacity, reflecting installations, retirements, reclassifications and data revisions. They do not measure all individual power plants commissioned after 2020. Coal, gas, nuclear and standalone battery capacity are omitted. A worldwide ranking of all-source generating capacity additions would require independently reconciled country inventories for the same observation dates, not an extrapolation from the IRENA renewable series.
IRENA combines official national reporting with industry figures and estimates. Solar capacity conventions can also differ between the DC rating of photovoltaic modules and the AC rating of grid export equipment, affecting cross-country comparisons. The U.S. Energy Information Administration’s generator inventory provides a valuable domestic cross-check, though its utility-scale and battery definitions must be reconciled before combining figures.
Primary reporting: IRENA Renewable Capacity Statistics 2026, complete country tables; IRENA publication and methodology; China National Energy Administration figures; and U.S. Energy Information Administration capacity reporting.
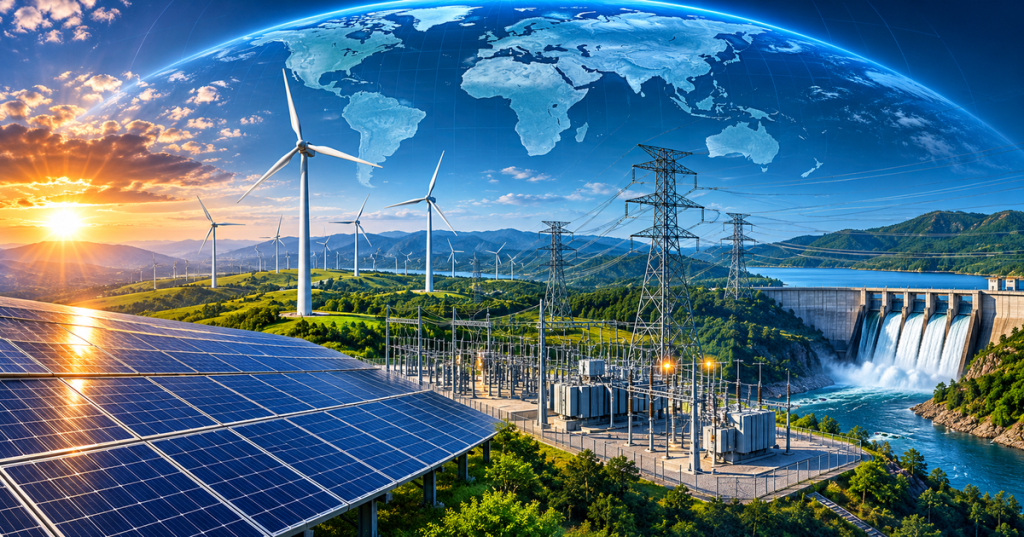
Editor’s Note: Ranking and charts were calculated from IRENA’s end-2020 and end-2025 installed renewable capacity values, with MW converted to GW. The cover is conceptual editorial artwork rather than a photograph of a specific generating facility. Fossil, nuclear and standalone storage capacity are excluded.
Support BitcoinVersus.Tech
The approved BitcoinVersus.Tech donation QR below is for a 5,000-satoshi contribution. On mobile, open the article on another screen and scan the image with a compatible Bitcoin wallet. Verify the destination and amount before confirming any transfer.
We volunteer daily to ensure the information on this platform is Verifiably True. If you would like to support the research, please scan QR code.


Leave a Reply