
Nuclear power generated 531.0 terawatt-hours (TWh) of U.S. electricity from January through August 2026, compared with 458.6 TWh from coal. Nuclear’s lead expanded to 72.4 TWh from 21.8 TWh a year earlier. The October 23 Energy Information Administration release shows nuclear production increasing 1.3% while coal generation fell 8.7% over identical eight-month windows. The widening gap measures actual electricity output, not installed megawatts or future forecasts.
Nuclear plants use controlled fission to heat water, produce steam and drive turbine generators. Coal stations burn solid fuel to produce steam for comparable turbine equipment. Both can deliver large quantities of dispatchable electricity, although grid demand, fuel costs, maintenance schedules, outages and operating economics shape their monthly output. Unlike nameplate capacity, net generation counts electricity produced after plant operating consumption.
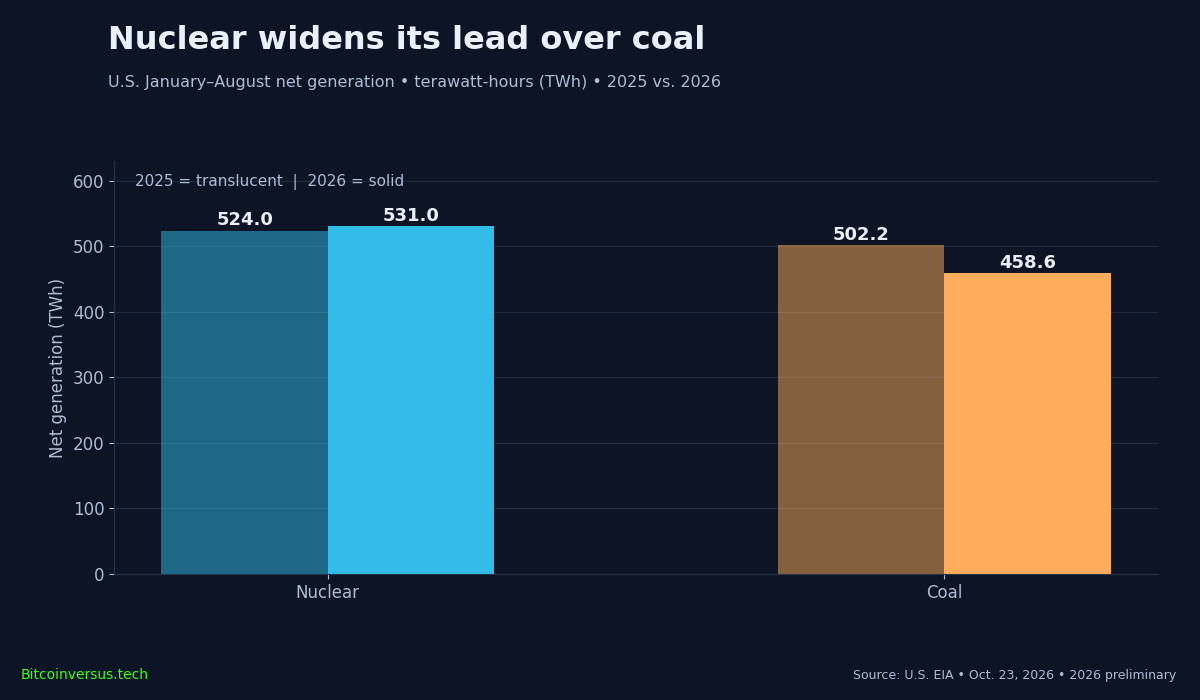
A 72.4 TWh advantage
The EIA reports 523.979 TWh of nuclear generation in January–August 2025 and 531.031 TWh for the matching 2026 period, a gain of 7.052 TWh. Coal dropped from 502.169 to 458.609 TWh, losing 43.560 TWh. Together, those movements enlarged the nuclear-minus-coal gap by 50.612 TWh. Relative to coal’s 2026 generation, nuclear produced approximately 15.8% more electricity, using the coal total as the percentage denominator.
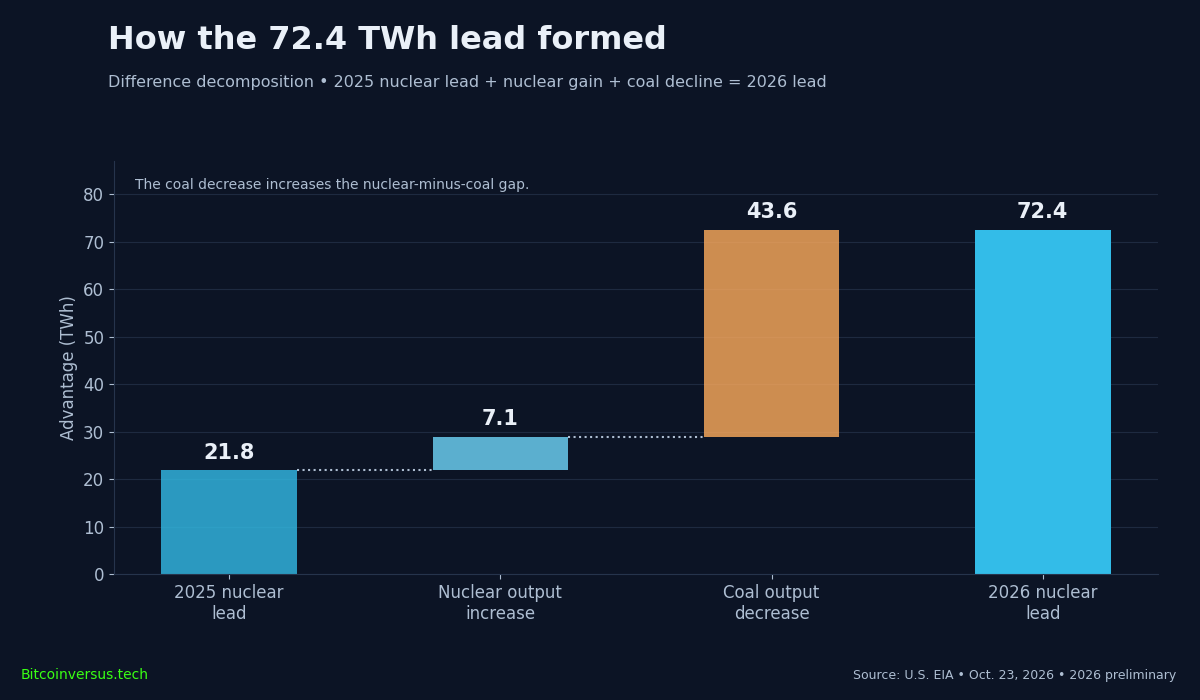
The emerging difference matters for grid planning: energy measured in TWh describes delivered production, whereas capacity factor compares actual output with a generator’s theoretical maximum over time. Neither eight-month production total proves a plant’s availability, cost per megawatt-hour or profitability.
Summer demand changed the monthly winner
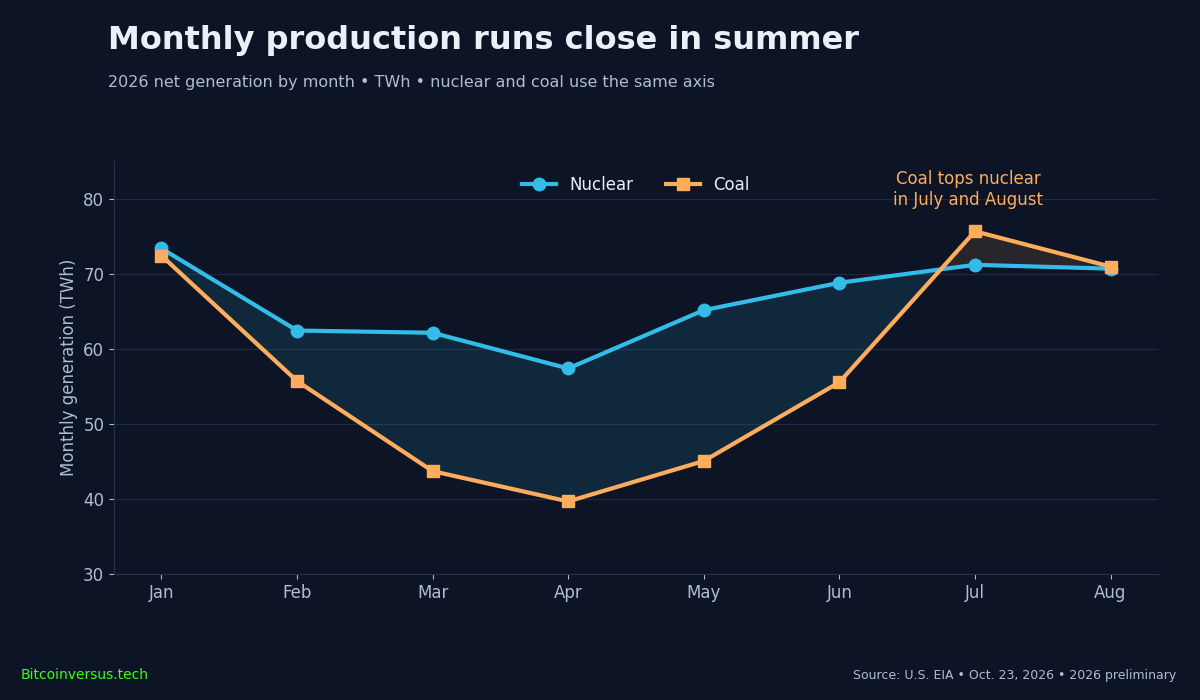
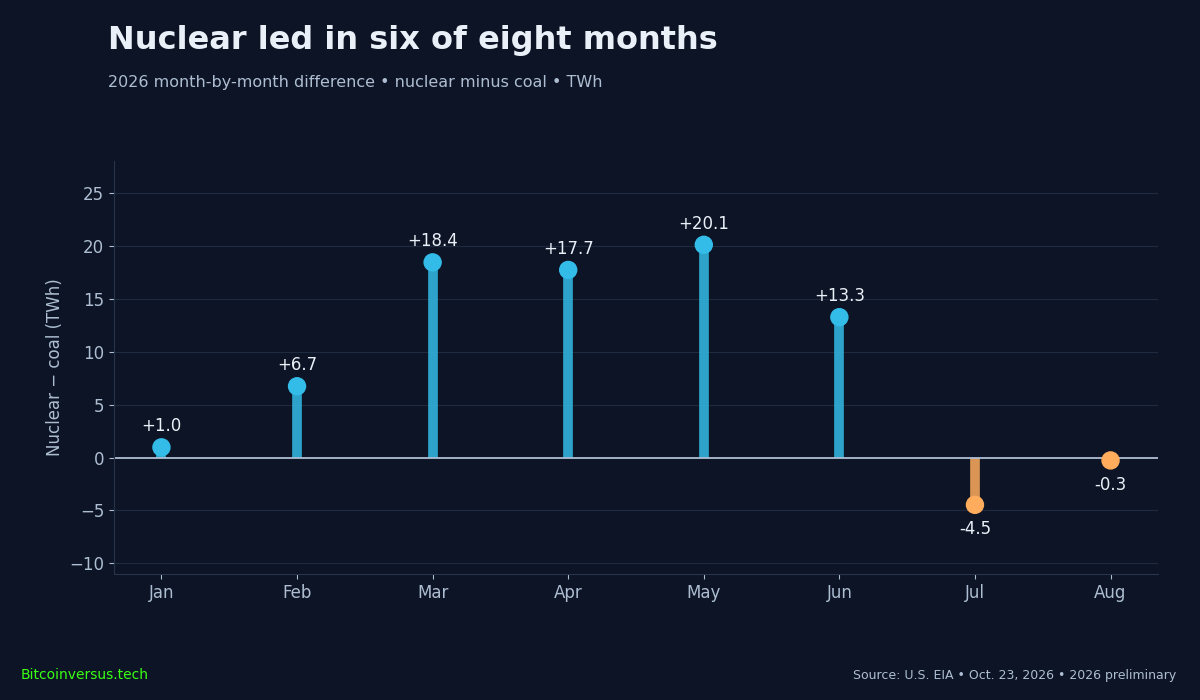
Nuclear exceeded coal in six of the first eight months of 2026, but coal narrowly overtook nuclear during both July and August. July coal output reached 75.639 TWh against 71.172 TWh for nuclear; August coal produced 70.937 TWh against nuclear’s 70.661 TWh. Electricity demand, plant operations and the summer cooling season can affect dispatch. The monthly comparison does not establish why any individual coal or nuclear generator changed production.
Coal contracted while nuclear held steady
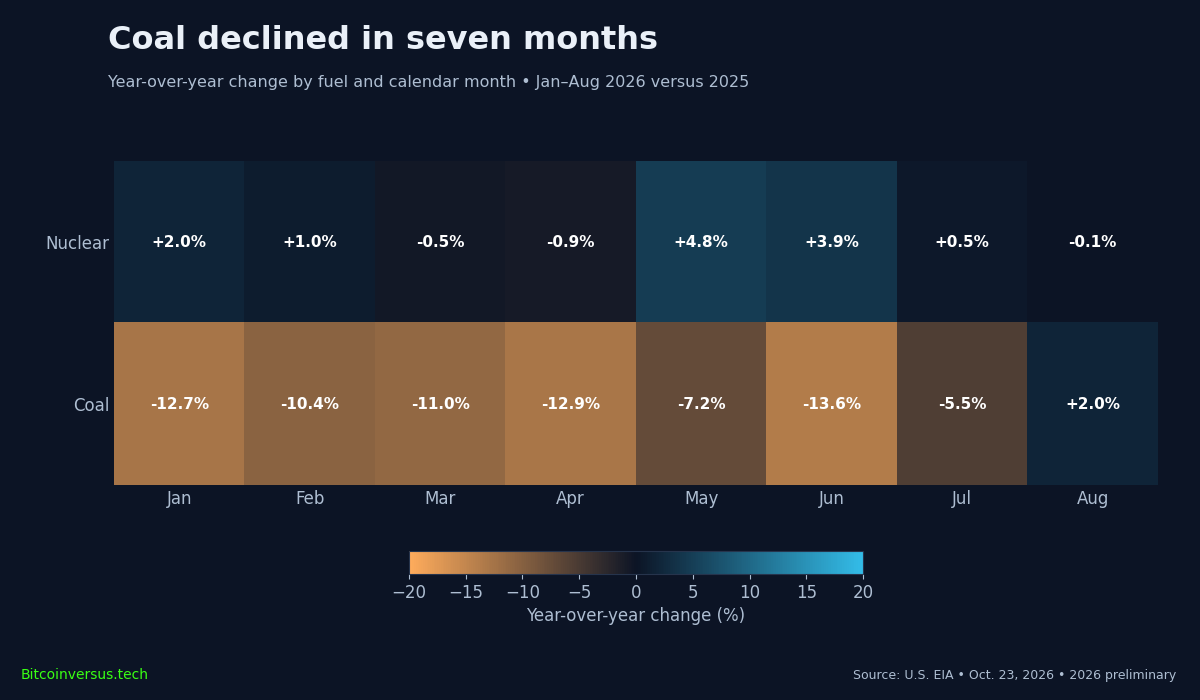
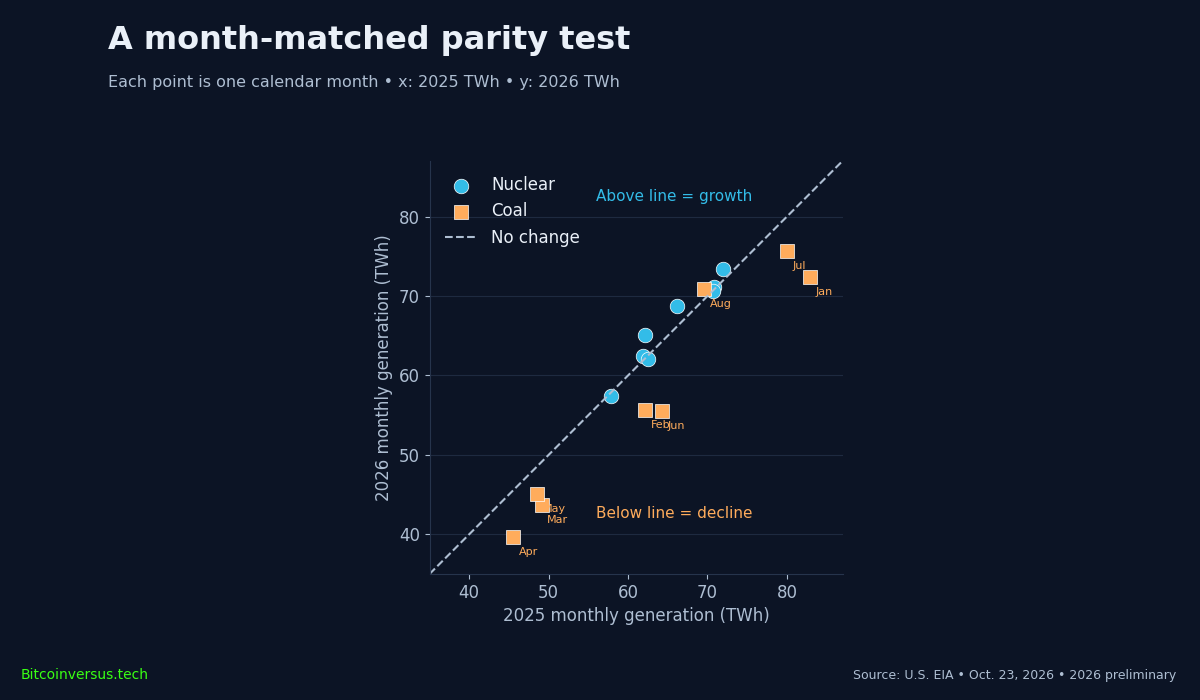
The year-over-year heatmap shows coal generation falling in seven of eight calendar months, with August increasing approximately 2.0%. Nuclear output was more stable: May grew about 4.8% and June 3.9%, while March, April and August registered small declines. A month-matched scatter plot checks the same pattern without pretending the sources have a causal relationship. Values above the diagonal indicate growth; values below reflect a decline.
Different strengths, different weaknesses
Nuclear’s defining advantages in the observed data were higher eight-month output, six monthly generation wins and a positive year-over-year change. Reactors also produce low direct operating carbon emissions and can run for extended intervals between refueling outages. Challenges include costly construction, radioactive-waste management, maintenance shutdowns and long development timelines. BitcoinVersus.Tech previously examined an Indiana nuclear proposal linked to Amazon, a project still under consideration rather than operating capacity.
Coal’s measurable strengths were higher generation in July, higher generation in August and a substantial operating fleet still supplying 14.9% of utility-scale power during the eight-month period. Fuel can be stored on-site and established plants can provide dispatchable service where infrastructure remains available. However, coal combustion produces carbon dioxide and other pollutants, while fuel, environmental compliance and maintenance costs affect dispatch economics. Read BitcoinVersus.Tech’s data-center energy project comparison for wider supply constraints.
The full electricity mix
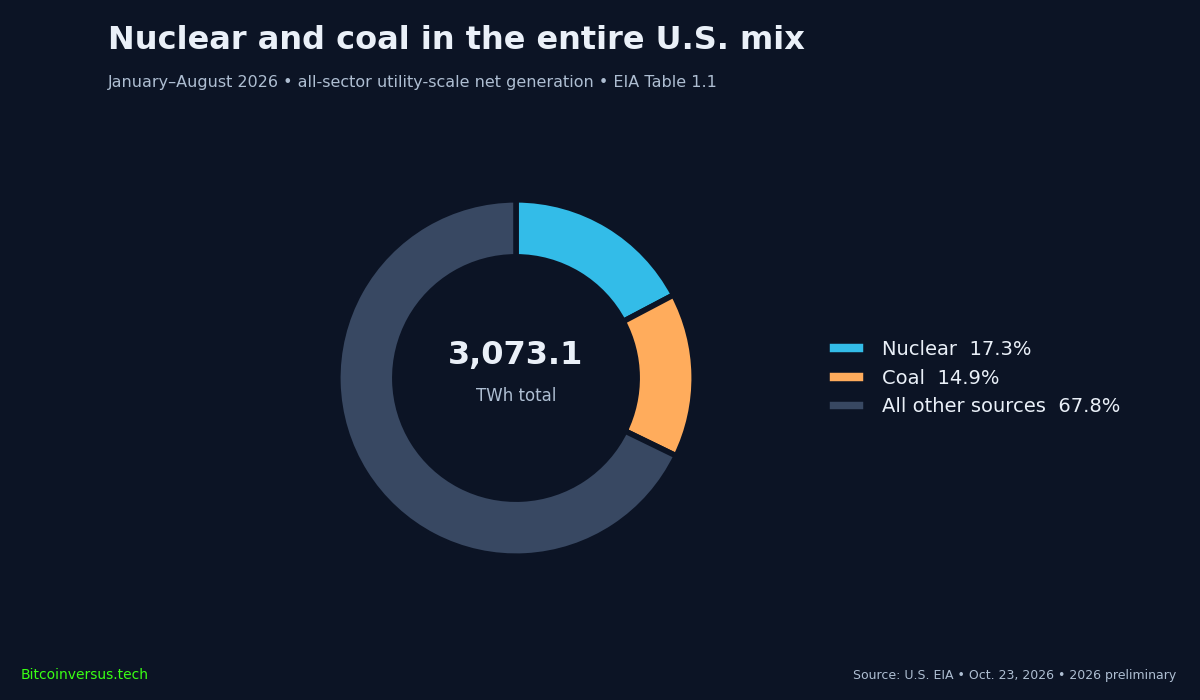
Using the EIA’s 3,073.105 TWh of total utility-scale net generation as the common denominator, nuclear supplied approximately 17.3%, coal 14.9%, and other sources 67.8% from January through August. A two-fuel-only percentage would exaggerate each source’s role in the grid. Wider trends in renewable expansion and power-demand forecasts add context but use different periods and should not be combined with observed generation totals.
SmartChart verdict
The evidence favors nuclear on delivered U.S. electricity through August 2026, not on every engineering or economic criterion. Seven different chart methods illuminate magnitude, timing, monthly outcomes, annual change and national share. Zero-based columns were chosen for generation magnitudes; lines for time, signed vertical dots for monthly gaps, a heatmap for calendar comparisons, a waterfall for gap accounting, a parity scatter for paired months and a donut for full-grid composition. Horizontal bar charts were excluded. Comparisons remain preliminary because EIA can revise 2026 data.
Editor’s Note
EIA Electric Power Monthly data for January–August 2026 were released October 23, 2026. All-sector utility-scale generation is used consistently; 2025 data are final and 2026 preliminary. Minor one-gigawatt-hour differences can arise when adding independently rounded monthly rows rather than using published year-to-date totals. The cover is illustrative, not a photograph of named plants. Charts use EIA observations, and no chart establishes causation, lifecycle emissions or levelized cost.
Support BitcoinVersus.Tech
Support independent technical reporting through an optional 5,000-satoshi contribution. Scan the original approved QR with a compatible Bitcoin wallet. On mobile, open the code on another screen or use your wallet’s supported image scanner. Verify the destination and amount before sending.

We volunteer daily to ensure the information on this platform is Verifiably True. If you would like to support the research, please scan QR code.


Leave a Reply