
A U.S. nuclear reactor splits uranium atoms to produce heat and steam, driving an electricity generator. A wind turbine converts moving air into mechanical rotation and then electrical power. Both produce low-carbon electricity during operation, but their output patterns differ sharply. The U.S. Energy Information Administration’s newly released 2025 Electric Power Annual enables a direct comparison of observed generation, installed generating capacity and capacity factors using the same reporting year.
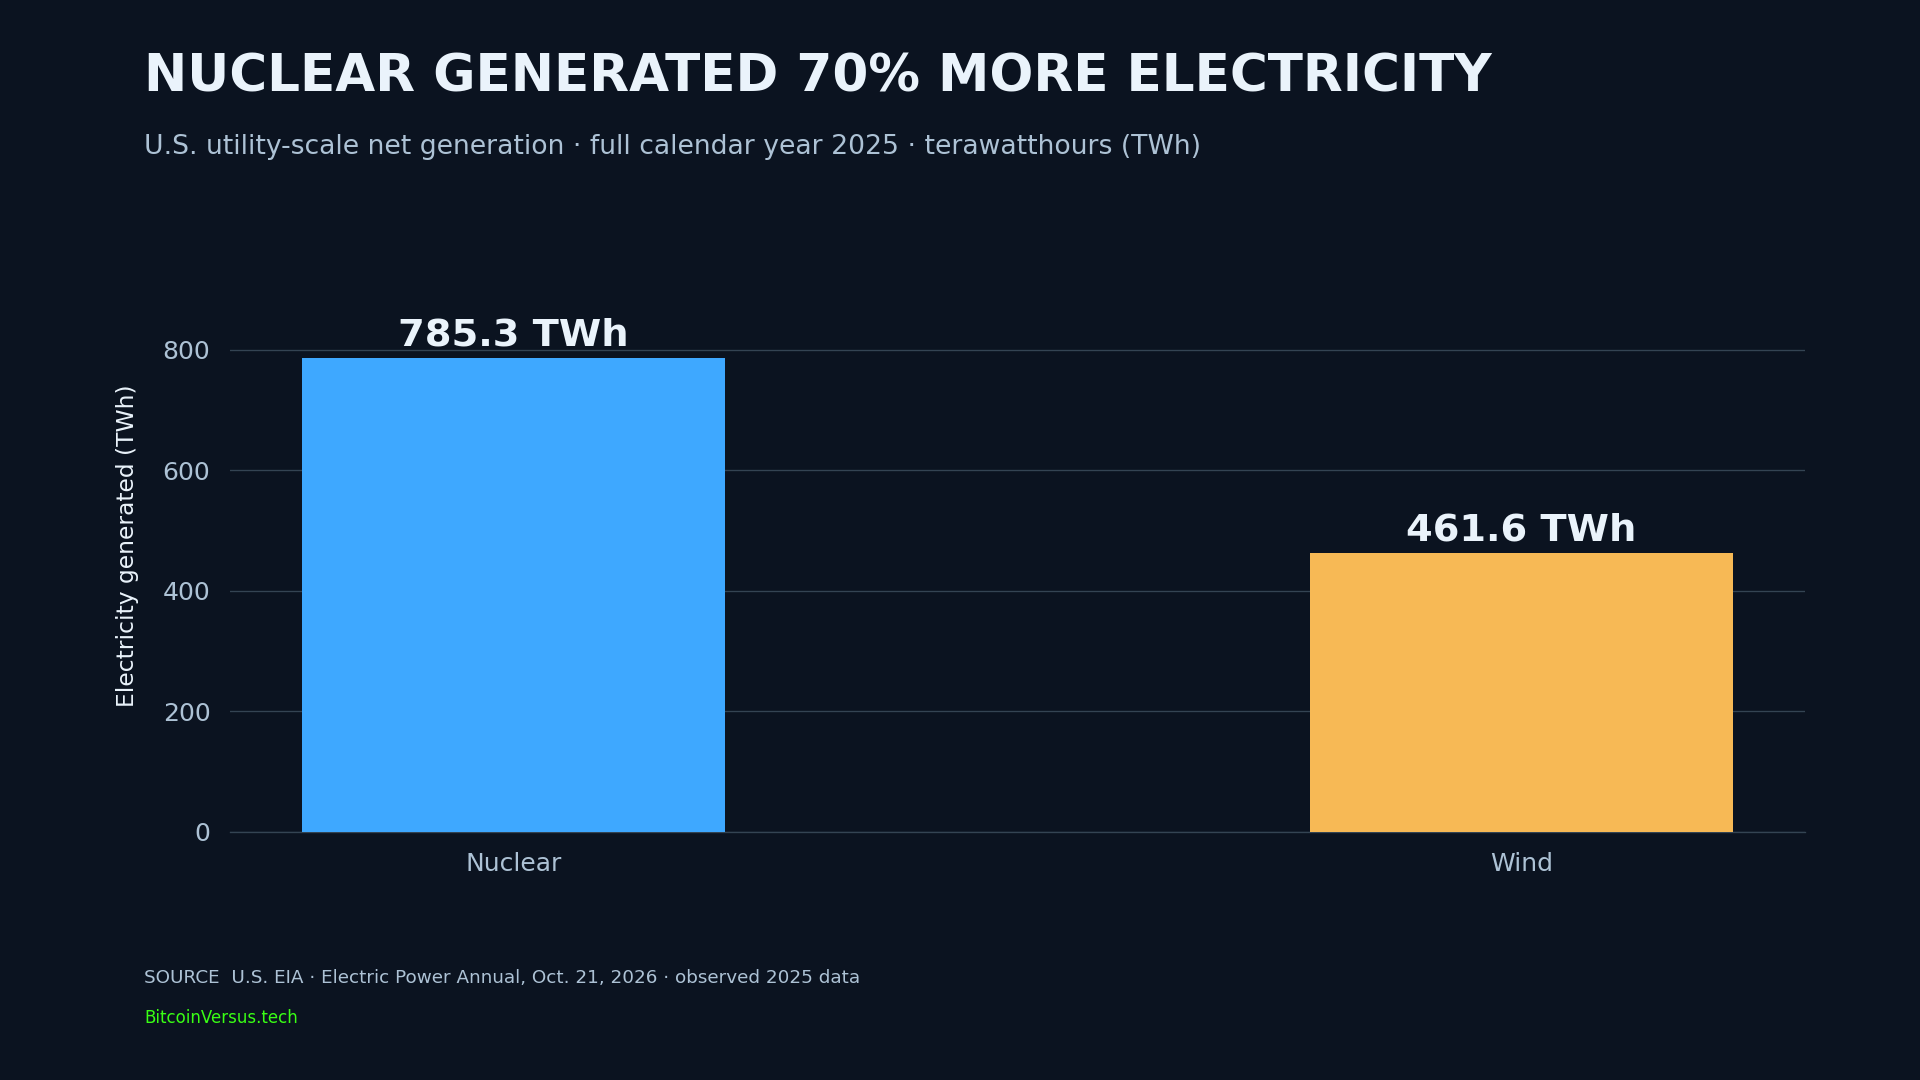
U.S. nuclear plants generated 785.304 terawatthours (TWh) in 2025, compared with 461.577 TWh from wind farms. Nuclear delivered 70.1% more electricity, or 323.727 TWh extra, despite a smaller installed fleet. Neither figure is a 2026 projection.
Wind Has More Generating Capacity
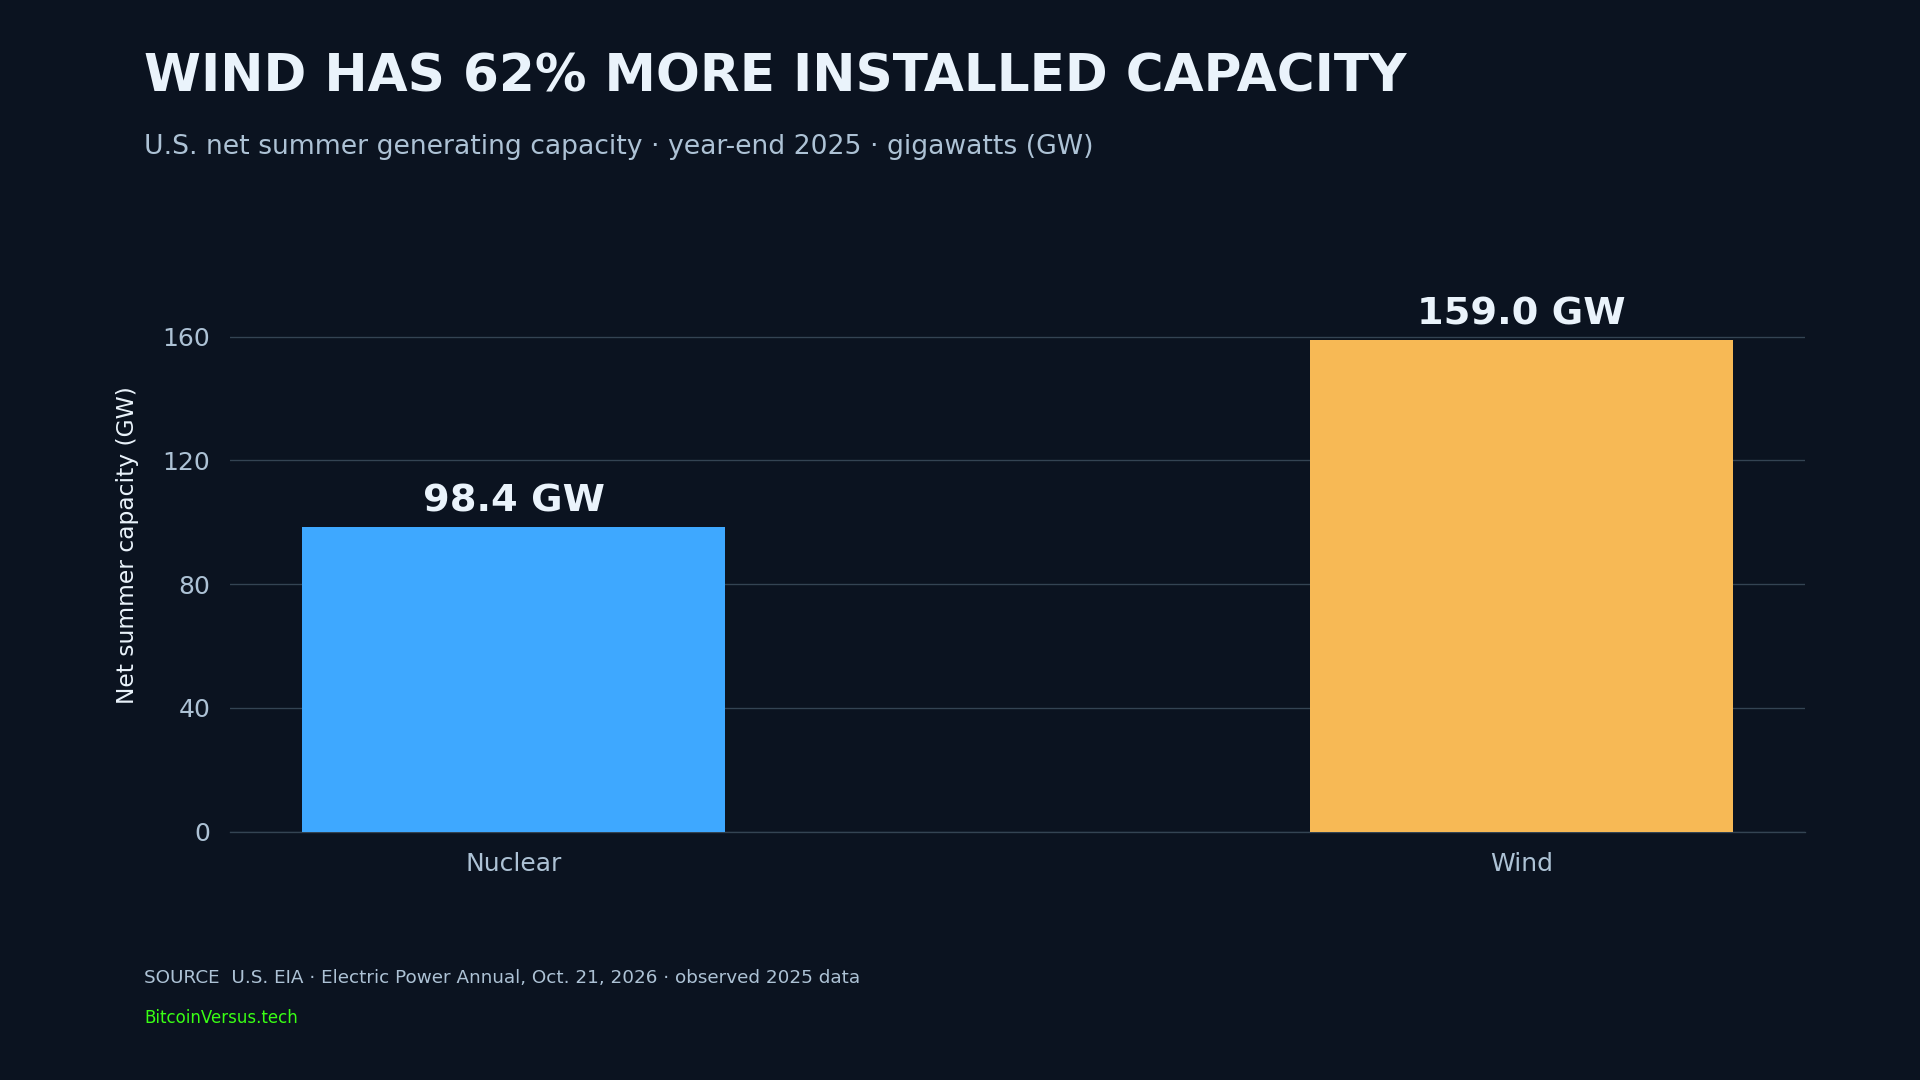
The capacity ranking reverses the result. According to EIA’s year-end generating-capacity inventory, U.S. wind equipment had 159.032 gigawatts (GW) of net summer capacity in 2025, compared with nuclear’s 98.423 GW. Wind therefore held 61.6% more capacity, or nuclear held 38.1% less than wind, depending on the denominator. Capacity measures potential electric power at an instant; TWh measures energy delivered over a year.
Grid planners cannot equate one nameplate gigawatt with continuous production. The distinction is detailed in BitcoinVersus.Tech’s capacity-factor engineering explainer and matters when estimating power supply for expanding U.S. data-center loads.
A 57.3-Point Capacity-Factor Gap
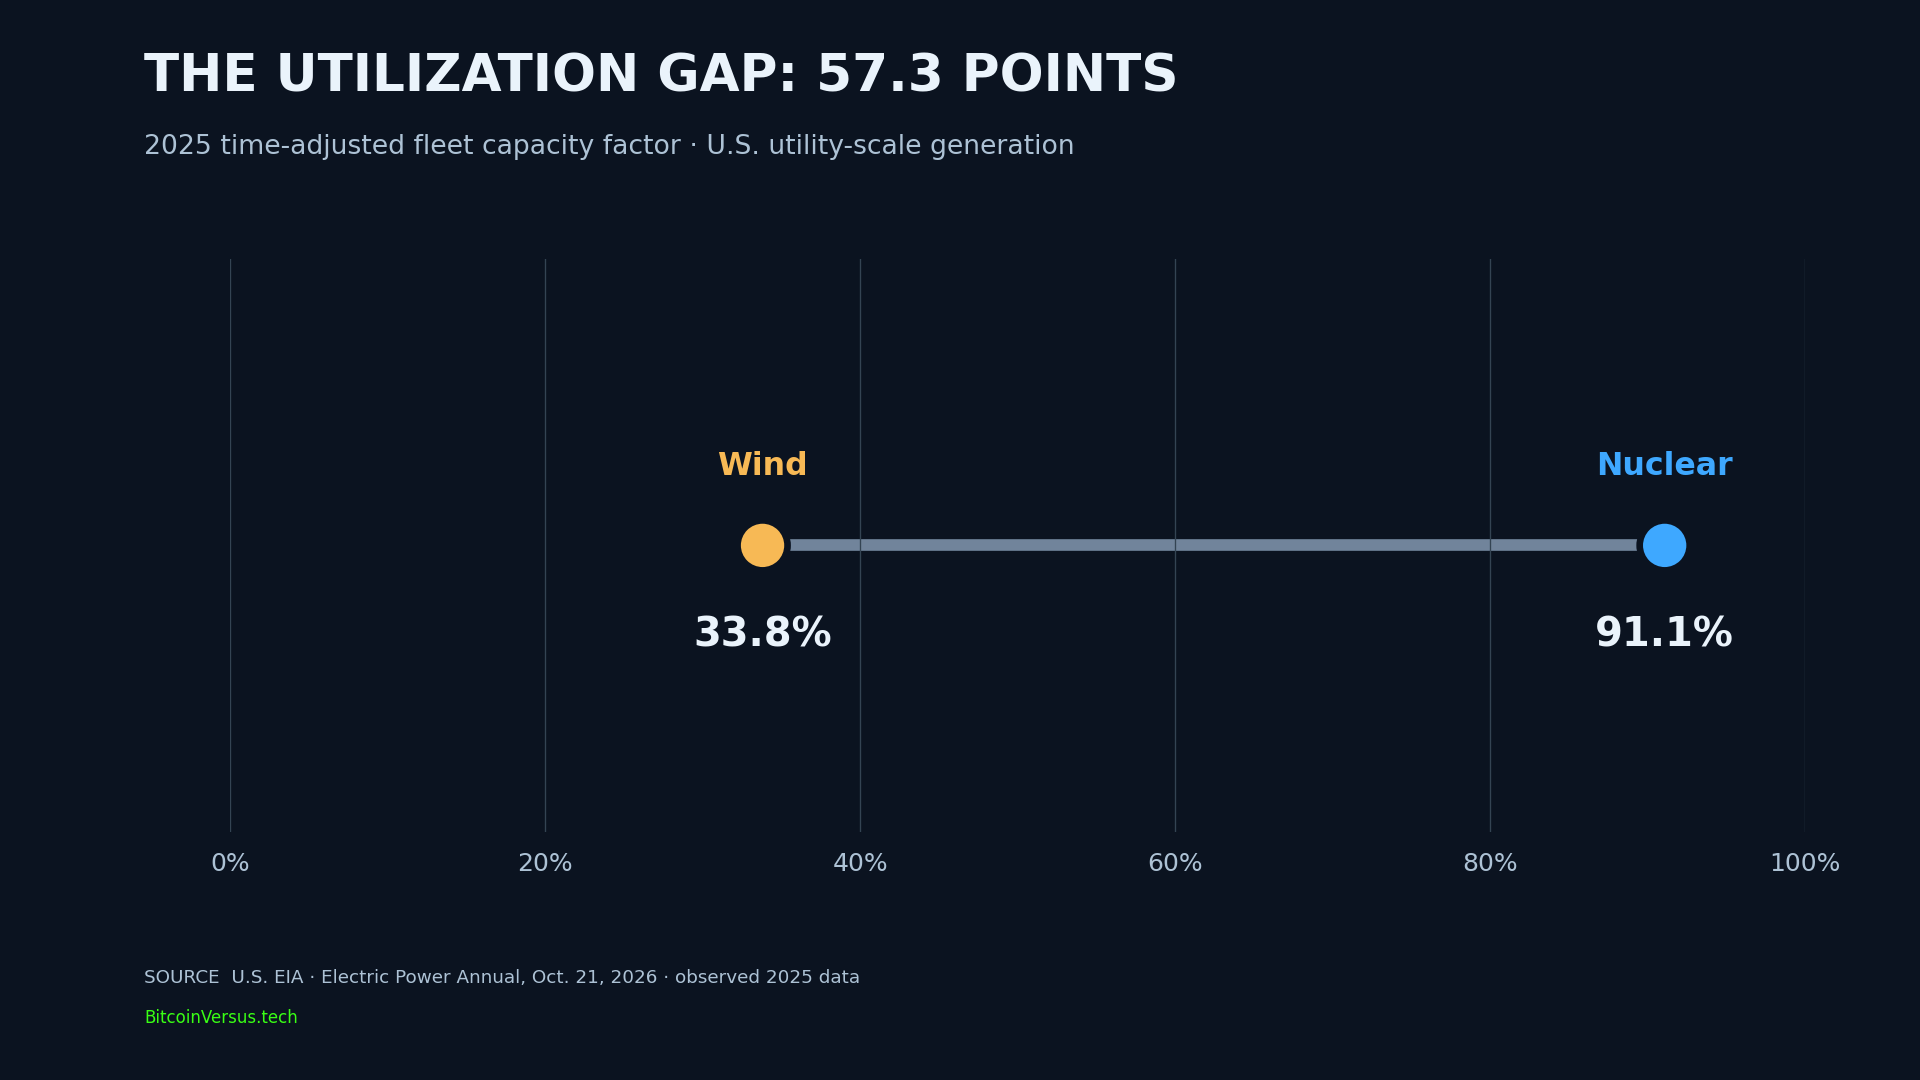
EIA reports a 91.1% nuclear capacity factor for 2025 against 33.8% for wind. The 57.3-percentage-point difference helps explain why nuclear generated more electricity with fewer installed gigawatts. Nuclear output can remain high between refueling outages, while wind production follows weather and can be limited by maintenance or transmission constraints.
The percentages use time-adjusted generating capacity, rather than simply dividing generation by the installed fleet at December 31. EIA reports time-adjusted capacity of about 98.408 GW for nuclear and 155.344 GW for wind. Capacity factor does not directly measure a generator’s contribution during an individual peak-demand hour or prove uninterrupted service.
Wind Wins the Decade’s Growth Race
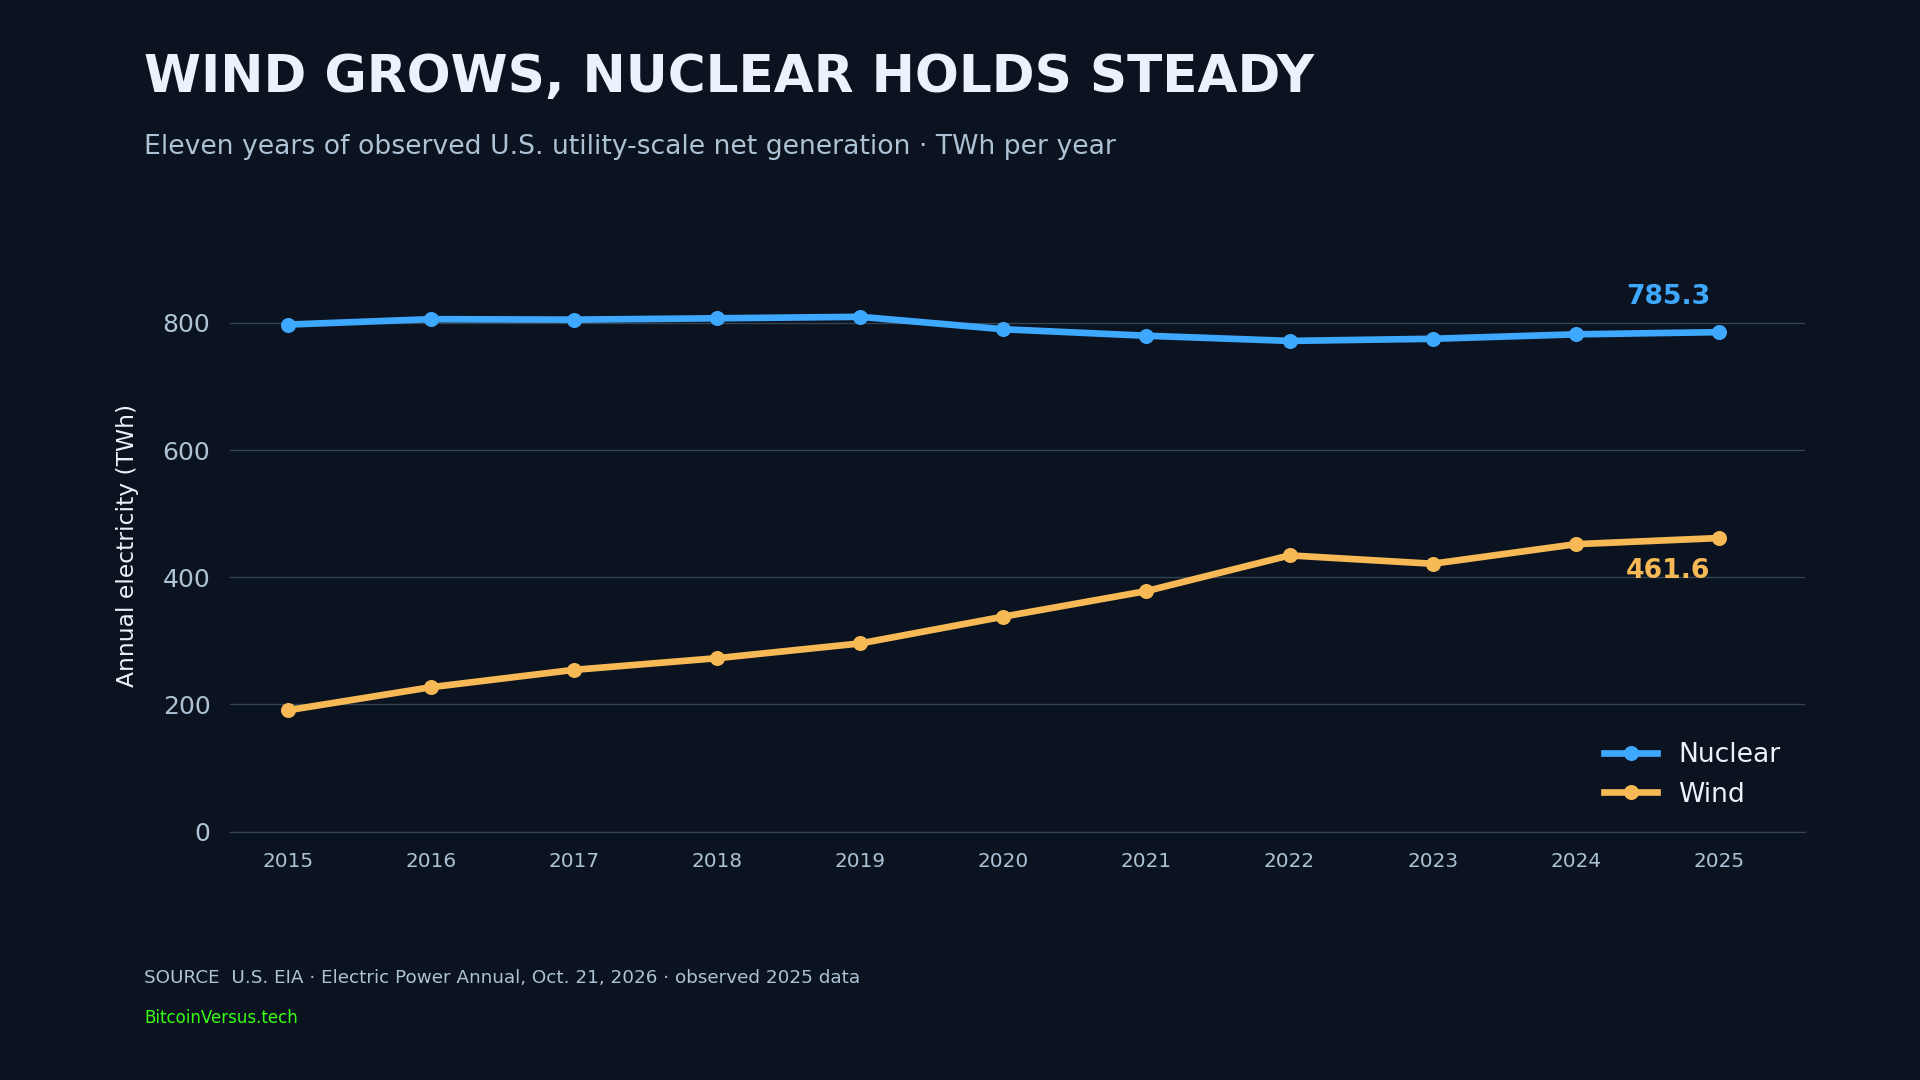
From 2015 to 2025, wind generation rose from 190.719 to 461.577 TWh, an increase of approximately 142%. Nuclear generation moved from 797.178 to 785.304 TWh, a decline of about 1.5%. During 2025 alone, wind output increased 2.1% from 2024, compared with a 0.4% rise for nuclear. Those growth rates compare observed annual output, not new construction spending or individual project efficiency.
Wind’s expanding fleet makes its electricity increasingly important alongside solar. BitcoinVersus.Tech recently documented solar’s 2026 monthly crossover against wind and a major offshore wind project entering full commercial operation. Those events provide current context without altering the 2025 annual comparison.
Reliability, Cost and the Evidence-Based Verdict
Nuclear leads on realized annual output and average utilization, but large reactors require complex construction, long-term waste management, cooling resources and substantial capital. Wind wins on installed summer capacity and ten-year generation growth, although variable weather, grid congestion and siting constraints affect dispatch and electricity value. Neither EIA table establishes which technology has lower delivered cost, better project economics or greater reliability at a specific location.
The defensible verdict is category-specific: nuclear wins 2025 electricity output and capacity factor; wind wins installed capacity and expansion. Both belong in any serious grid-planning discussion. As BitcoinVersus.Tech’s guide to clean versus renewable electricity explains, nuclear’s low-carbon status and wind’s renewable status describe different attributes; neither label alone determines a grid’s operating performance.
Primary sources: EIA Annual Table 1.2 (generation, 2015–2025); EIA Table 4.3 (2025 summer capacity); EIA Table 4.08.B (capacity factor). Published October 21, 2026. All chart calculations use EIA observations.
BitcoinVersus.Tech Editor’s Note
Figures represent utility-scale U.S. electric power in calendar 2025, as published by EIA on October 21, 2026. Capacity is year-end net summer power; capacity factors use time-adjusted fleet capacity. The featured image is conceptual illustration, not a documentary photograph of one co-located nuclear and wind installation. Neither series proves future output or the economic superiority of a technology.
We volunteer daily to ensure the information on this platform is Verifiably True. If you would like to support the research, please scan QR code.

To donate 5,000 satoshis, scan the QR code from a separate screen or use a wallet supporting saved-image scanning. Verify the destination address 3C9o19EH5HSiwEPyCTmEKzxhNCbo2X6TTb and the amount before confirming.
BitcoinVersus.Tech is not a financial advisor. Financial subjects are reported for informational purposes only.


Leave a Reply