
U.S. solar power generated more electricity than wind power for four consecutive months, May through August 2026, according to the Energy Information Administration’s latest Electric Power Monthly data released October 23. The trend illustrates solar’s strong summer output as utilities respond to rising demand from homes, industry and data centers.
In August, solar supplied 49.206 billion kilowatthours (BkWh), compared with wind’s 33.317 BkWh. In July, the gap was even wider: 51.956 BkWh of solar against 31.889 BkWh of wind. These are observed monthly generation figures, not installed gigawatts or forecasts.
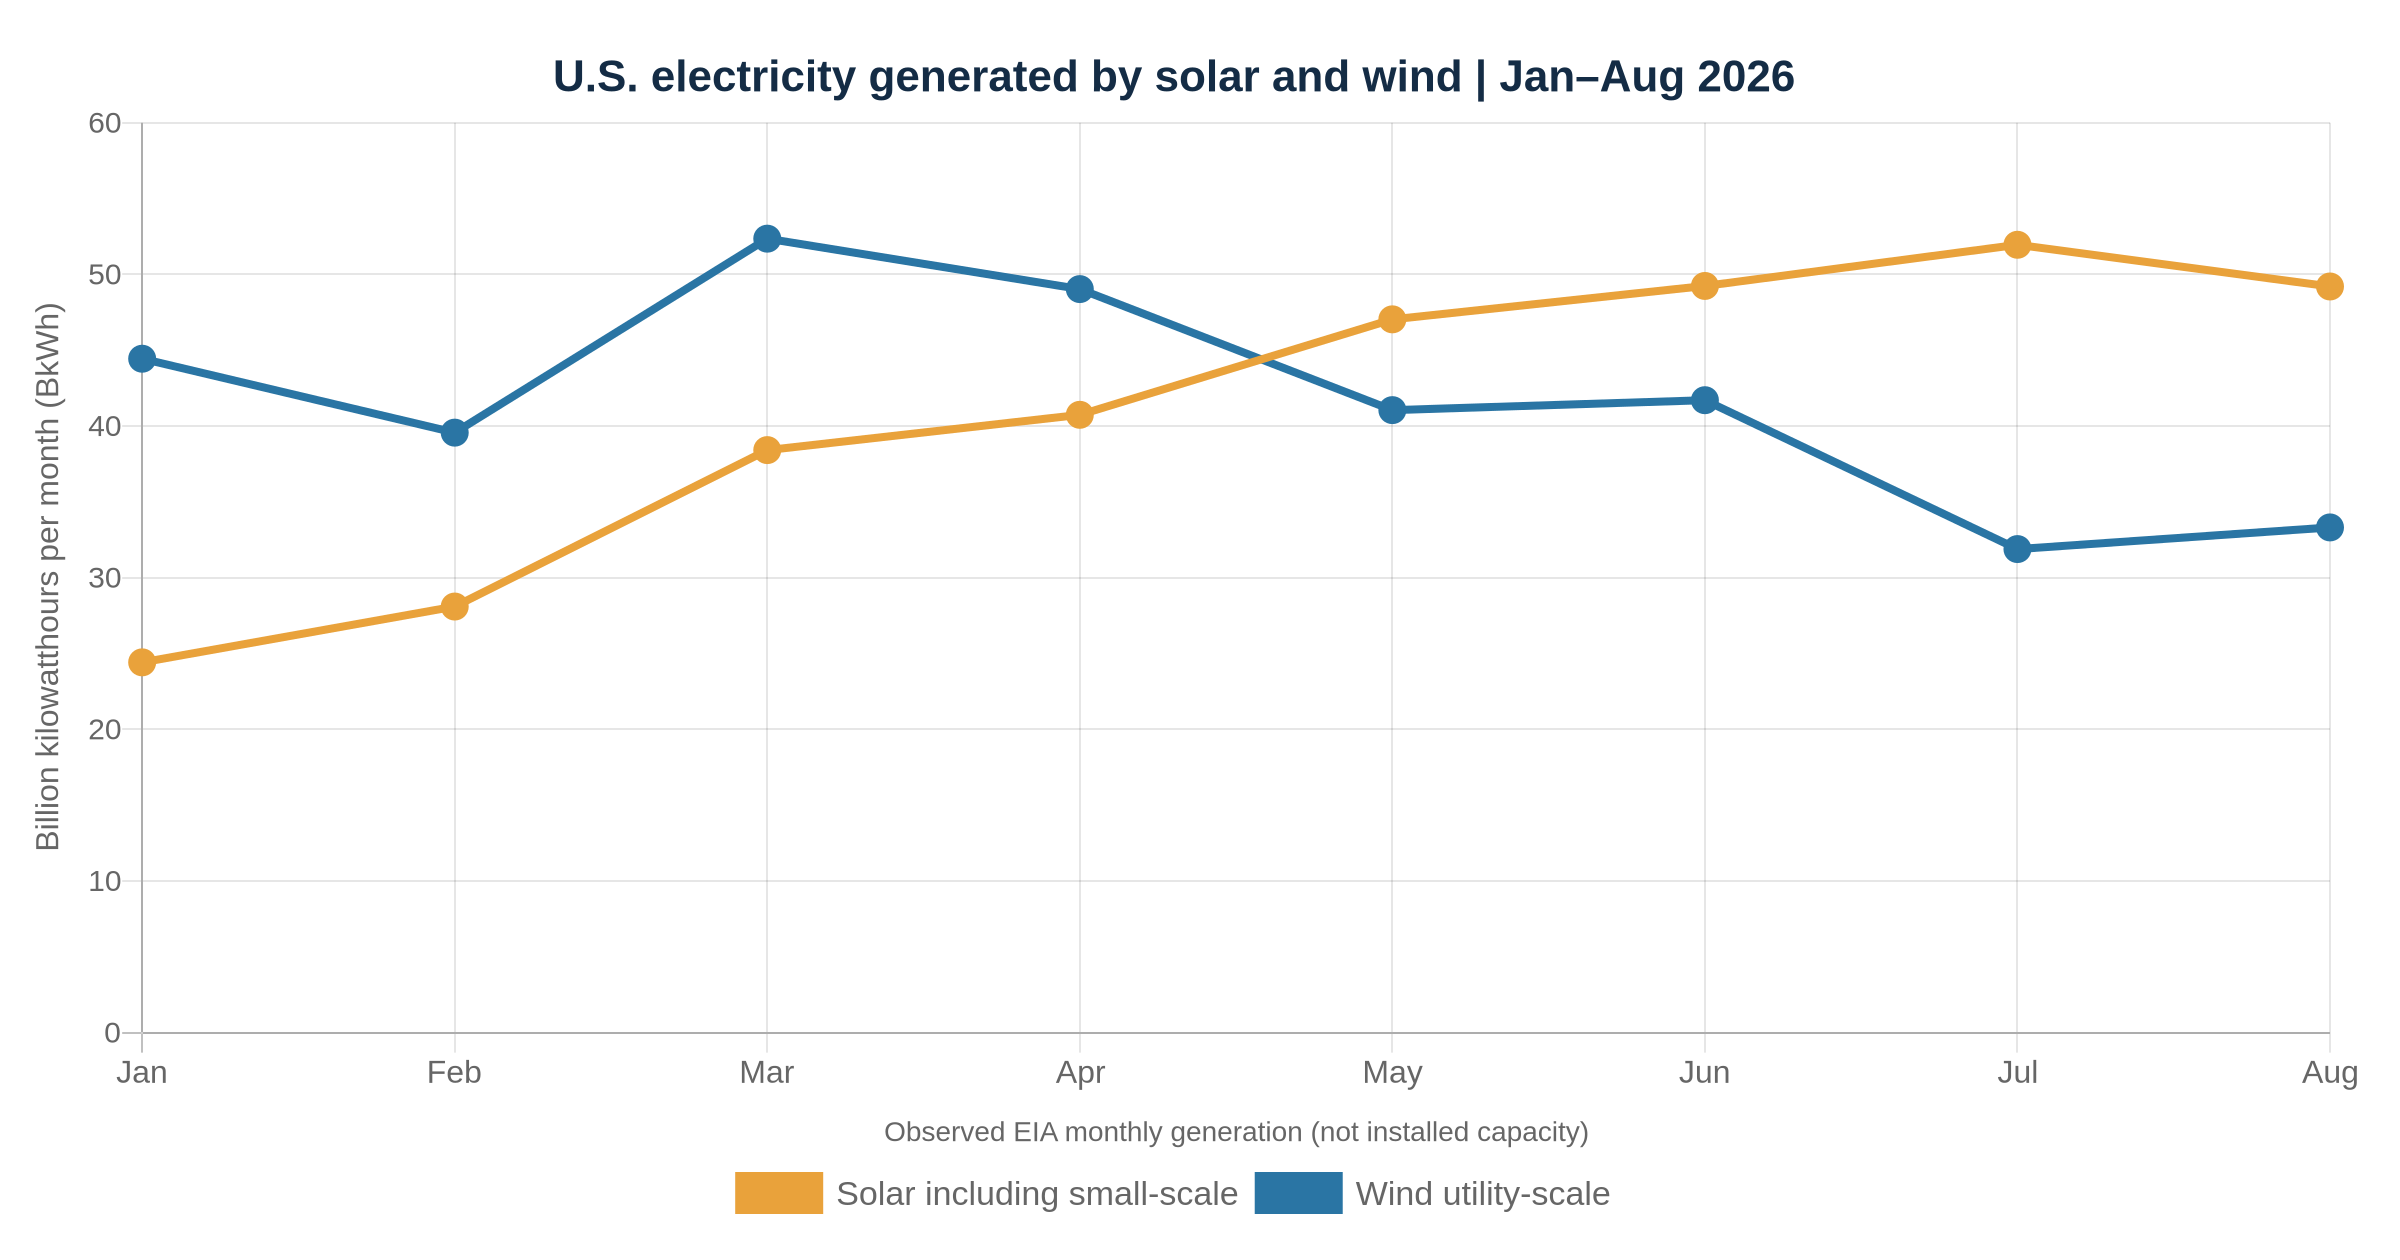
The Crossover Happened in May
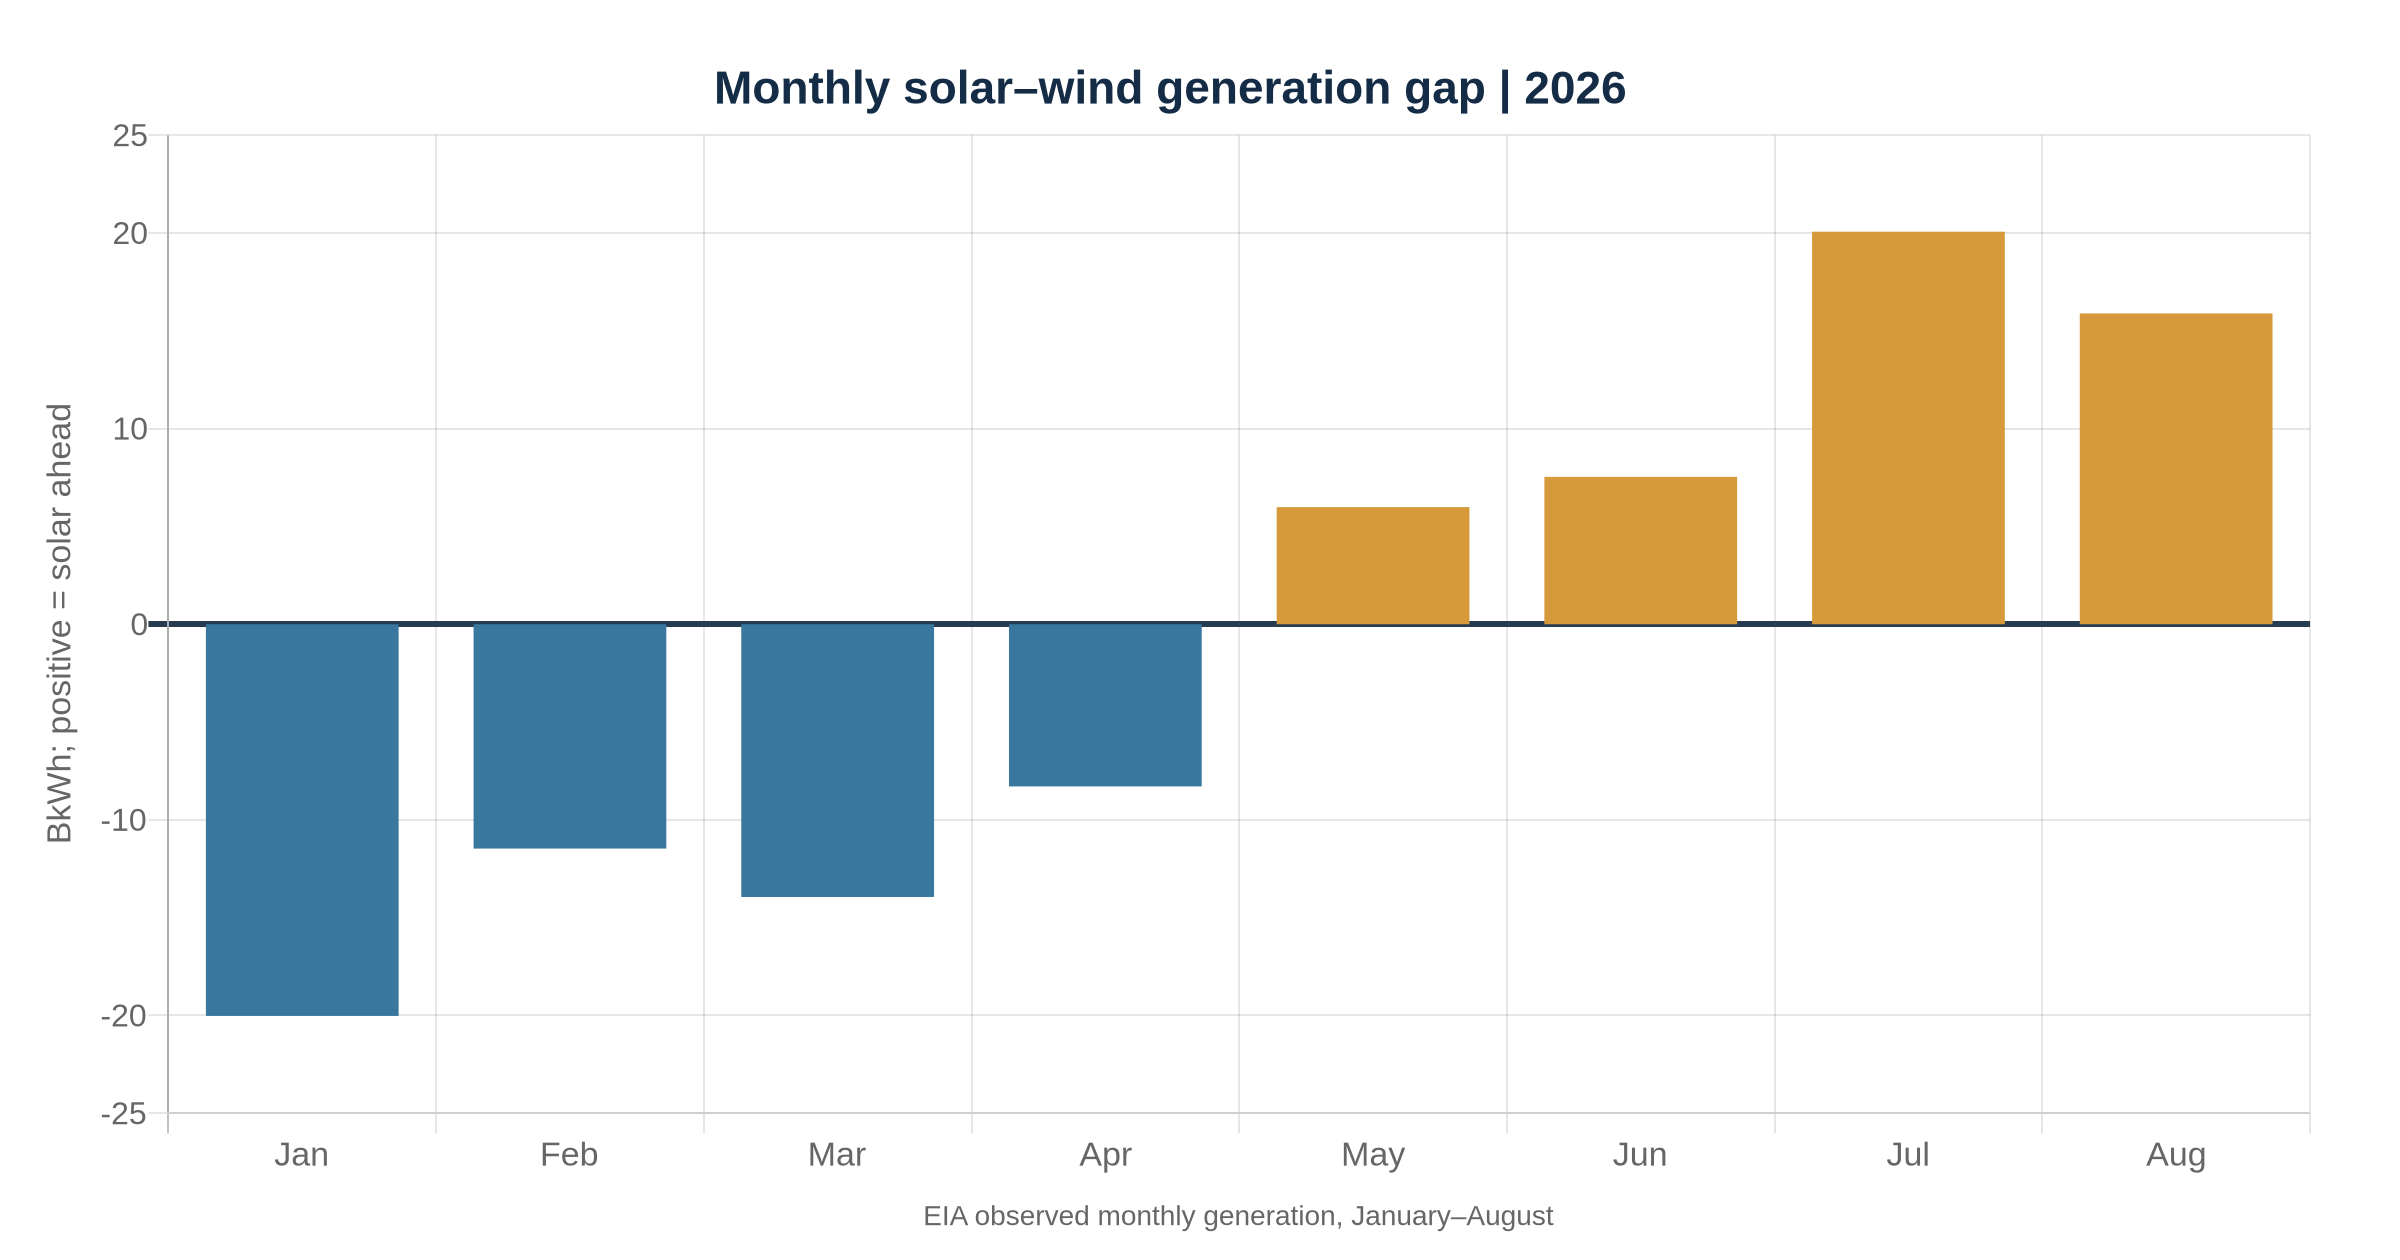
January through April were wind-led. Solar’s monthly advantage turned positive in May at 5.987 BkWh and expanded to 7.534 BkWh in June, 20.067 BkWh in July and 15.889 BkWh in August. The changes reflect seasonal output as well as the growing solar fleet; they do not establish that one technology replaced the other at individual plants.
Solar had exceeded wind during parts of summer 2025 too, so the 2026 result is not a first-ever crossover. The EIA series includes estimated small-scale solar photovoltaic generation alongside utility-scale solar, whereas its reported wind generation is utility-scale. Readers should consider that accounting distinction.
Wind Still Led the Year-to-Date Total
Across January through August, wind generated 333.367 BkWh versus solar’s 329.119 BkWh, retaining a 4.248 BkWh lead. Four strong solar months therefore do not establish an annual victory. Longer winter nights, regional wind patterns and curtailment can shift the balance across the remaining months.
This distinction between capacity and generation also matters for recent projects like DTE’s Fish Creek solar facility and Boralex’s wind portfolio. A project’s nameplate megawatts do not say how many kilowatthours it actually delivers.
The next EIA monthly release is scheduled for November 24. Until then, the responsible conclusion is a four-month solar lead within the observed 2026 monthly series—not a claim about full-year generation or every regional grid.
BitcoinVersus.Tech
BitcoinVersus.Tech Editor’s Note: We volunteer daily to ensure the credibility of the information on this platform is Verifiably True. If you would like to support our work and help further secure the integrity of our research initiatives, please scan the QR code below to donate 5,000 sats. For best results, scan the QR code from a laptop or larger screen.

Bitcoin address: 3C9o19EH5HSiwEPyCTmEKzxhNCbo2X6TTb. On a phone, open the QR image on another screen or copy and verify the address in your wallet before sending.
BitcoinVersus.tech is not a financial advisor. This media platform reports on financial subjects purely for informational purposes.


Leave a Reply