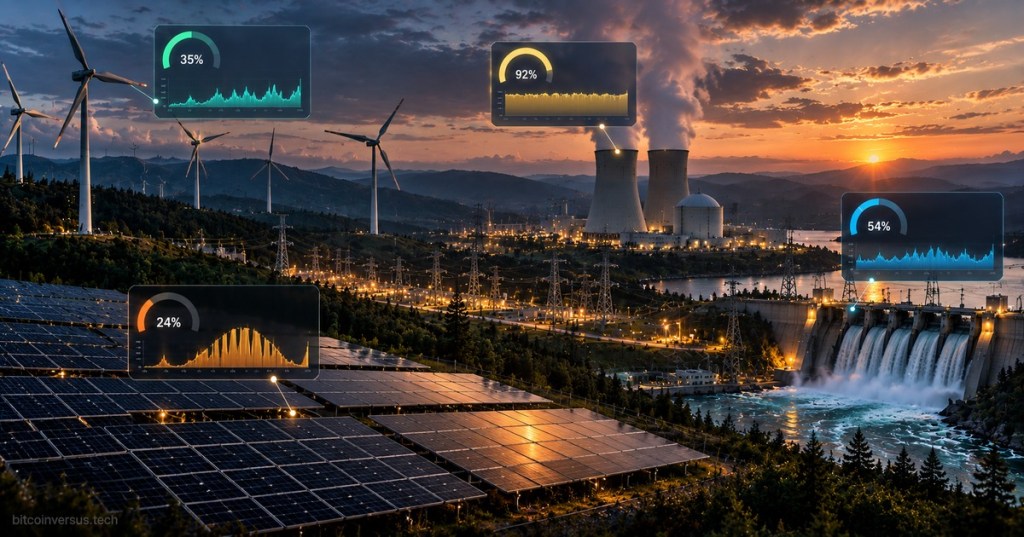
A power plant’s nameplate capacity tells you how much power it can produce at a moment in time. Capacity factor tells you how much of that theoretical maximum it actually produces over a longer period. That difference is why two 1 GW power plants can generate very different amounts of electricity over a year.
The U.S. Energy Information Administration defines capacity factor as the ratio between the electricity a generating unit actually produces during a period and the electricity it could have produced by operating continuously at full power during that same period.
Capacity Factor Is a Utilization Number
The basic formula is simple:
Capacity Factor = Actual Energy Produced ÷ Maximum Possible Energy
A 1 GW generator running at full output every hour for one year would theoretically produce 8.76 TWh because there are 8,760 hours in a normal year. If that same plant actually produces 4.38 TWh, its annual capacity factor is 50%.
This is different from the distinction explained in BitcoinVersus’ MW vs. MWh guide. MW is a power rate; MWh is energy accumulated over time. Capacity factor compares the real MWh produced against the maximum MWh the installed MW could theoretically produce.
A 1 GW Plant Can Produce Very Different Annual Energy
Imagine three different 1 GW plants. At a 90% capacity factor, annual generation would be about 7.88 TWh. At 35%, it would be about 3.07 TWh. At 24%, it would be about 2.10 TWh.
The nameplate rating never changed: all three plants are still 1 GW. What changed is how often each plant can actually operate near that rating over the year.
Why Nuclear Usually Has a High Capacity Factor
Nuclear plants are designed to run for long stretches between refueling and major maintenance outages. When operating normally, they can remain close to full output day and night regardless of sunlight or wind conditions.
In the EIA’s 2024 U.S. utility-scale capacity-factor data, nuclear averaged 90.8%. Geothermal averaged 64.6%, wind 34.3%, hydroelectric 34.6%, and utility-scale solar photovoltaic 23.2%.
Those percentages do not tell you which technology is “better.” They tell you how much each fleet generated relative to its maximum theoretical output under the conditions, operating practices and resource availability of that year.
Why Solar Has a Lower Capacity Factor
A solar farm can reach its nameplate rating around strong midday conditions, but it produces nothing at night and less during clouds, winter months or weak sun angles. A 1 GW solar farm therefore cannot produce 1 GW continuously for 8,760 hours.
That does not mean solar panels are only about 23% efficient. Capacity factor and conversion efficiency are completely different measurements. Panel efficiency asks how much incoming sunlight is converted into electricity; capacity factor asks how much electricity the entire plant actually generated compared with continuous full-power operation.
Large solar portfolios such as the 715 MW Exus portfolio recently covered by BitcoinVersus are therefore best understood by looking at both installed MW and expected annual MWh, not the MW headline alone.
Why Wind Capacity Factor Depends Heavily on Location
A wind turbine’s nameplate capacity describes its maximum rated electrical output. Its real annual generation depends on wind speed distribution, rotor size, hub height, turbine design, wake losses, curtailment and outages.
This is why two identical wind turbines can have very different capacity factors when installed in different places. A strong, consistent wind resource can make the same hardware dramatically more productive.
Capacity Factor Is Not the Same as Reliability
A generator can have a low annual capacity factor without being unreliable. A gas peaker, for example, may sit idle most of the year because the grid only needs it during short periods of very high demand. Its low capacity factor can reflect its economic role rather than poor mechanical performance.
Likewise, a wind or solar farm can be mechanically available but still produce less than nameplate capacity because the weather resource is weak at that moment. Availability measures whether equipment is ready to run; capacity factor measures how much energy it actually produced relative to the maximum possible.
Capacity Factor Is Not the Same as Efficiency
Efficiency compares useful electrical output with the energy entering a conversion process. A thermal power plant might convert only part of its fuel’s heat into electricity while still maintaining a high capacity factor by operating almost continuously.
A solar farm can use highly efficient modules yet still have a modest capacity factor because there is no sunlight at night. Mixing the two terms leads to bad comparisons between technologies.
Storage Can Raise the Capacity Value of Variable Generation Without Changing the Sun or Wind
Batteries cannot make the sun shine longer or the wind blow harder, but they can shift electricity from hours of high renewable output into hours of higher demand. That improves how useful variable generation is to the grid even though the underlying solar or wind capacity factor is still determined by actual generation.
This is why the distinction in BitcoinVersus’ clean vs. renewable energy guide matters. Batteries are not primary renewable energy sources, but they can make renewable generation much more valuable by changing when its electricity reaches the grid.
Why Capacity Factor Matters for Data Centers and Bitcoin Mining
A 100 MW data center or Bitcoin mine needs more than a generator with “100 MW” printed on its specification sheet. Operators need to know how many hours that generation is expected to be available, what its annual energy production looks like and what backup, storage or grid imports are required when output falls.
For 24/7 loads, annual MWh, hourly production shape and firm capacity can matter more than a headline MW number. A site powered by 100 MW of solar has a very different operating profile from one supplied by 100 MW of nuclear, geothermal or dispatchable generation.
The Simple Rule
Nameplate capacity tells you how big the generator is. Capacity factor tells you how much of that theoretical output it actually delivered over time.
Whenever you see a headline announcing a new 500 MW, 1 GW or 10 GW power project, the next question should be: at what expected capacity factor? That one number can dramatically change how much usable energy the project will actually produce over a year.
BitcoinVersus.Tech
Advertisement
Editor’s Note:
We volunteer daily to ensure the credibility of the information on this platform is Verifiably True. If you would like to support our research initiatives, please donate here: 3C9o19EH5HSiwEPyCTmEKzxhNCbo2X6TTb
BitcoinVersus.tech is not a financial advisor. This media platform reports on financial subjects purely for informational purposes.


Leave a Reply