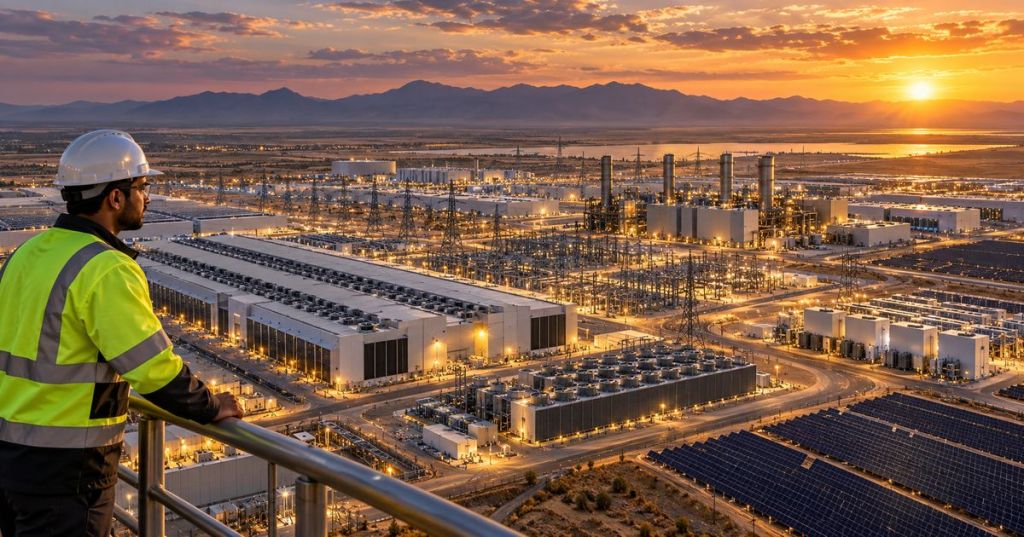
The largest U.S. data center power proposals now stretch from Texas gas-generation campuses to abandoned industrial sites in Ohio and Pennsylvania. A review of BitcoinVersus.Tech’s 2026 state-by-state data center power rankings identifies ten especially large, individually attributable projects, presented as a countdown from No. 10 to No. 1. Their ambitions reach roughly 4 to 11 gigawatts apiece, but almost all of that capacity remains prospective.
This national countdown compares reported maximum development scale as of October 31, 2026, not current electricity consumption. Disclosures differ: some measure prospective power generation, some planned IT or compute capacity, and others an entire site’s theoretical buildout. The numbers are shown with their measurement type and should not be added together as proven future demand, let alone as generation or computing online today.
10. Tract Caldwell Valley, Texas — 4 GW Site Capacity
Tract’s Caldwell Valley Technology Park comprises nearly 3,000 acres in Caldwell County with roughly 4 GW of marketed development capacity. The campus combines planned data-center plots with prospective transmission and natural-gas infrastructure, but the master-plan number does not represent a signed four-gigawatt supply contract.
Tract’s own development materials identify an initial smaller substation program and future energization rather than completed full-build service. Early phases are far easier to validate than the ultimate 4 GW figure. The Texas Top 7 explains the distinction and how Caldwell compares with Fermi, Galaxy and IREN.
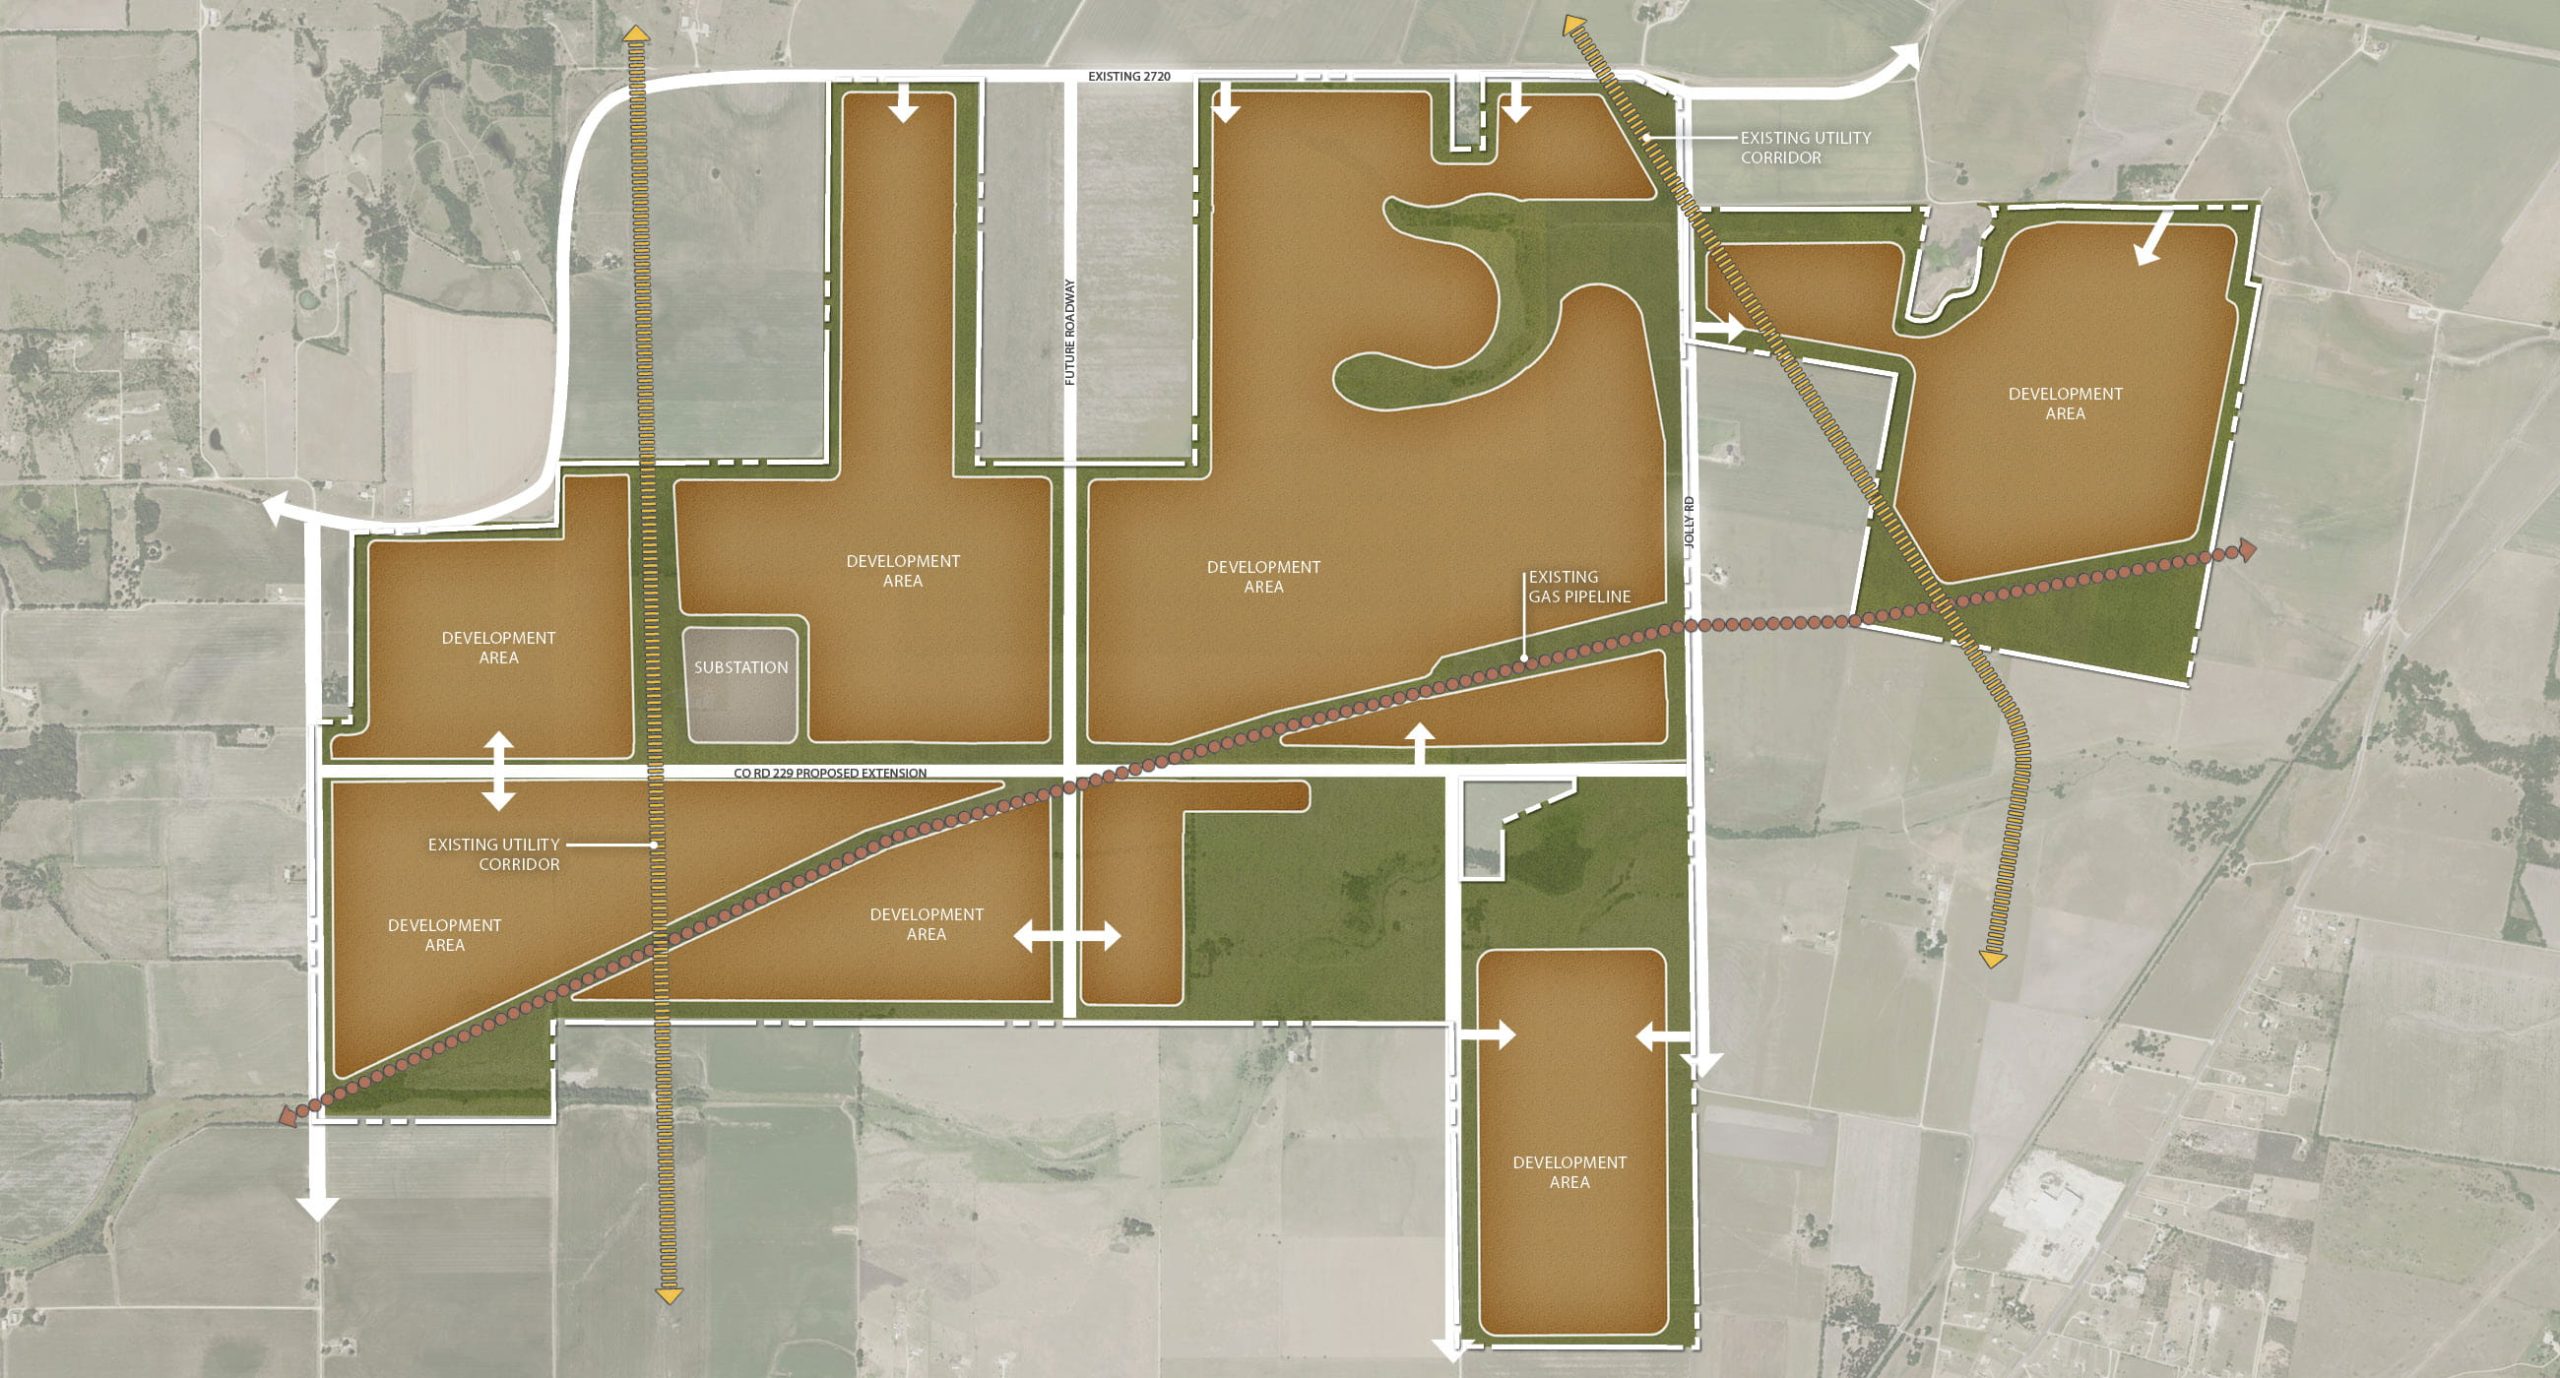
Caldwell Valley ties Joule at approximately 4 GW in the chart. A later commissioned-capacity ranking could produce a dramatically different order.
9. Joule High-Performance Compute Campus, Utah — 4 GW Energy Plan
Joule Capital Partners and Caterpillar have publicized a four-gigawatt total-energy design for a high-performance compute campus in Utah. Their approach centers on gas-powered distributed generation, integrated cooling and recovery of waste heat from equipment, rather than depending solely on distant grid deliveries.
The arrangement is a significant equipment and development proposal, but that does not establish that 4 GW of generators are installed, financed and operating today. Important unknowns include phasing, fuel arrangements, emissions conditions and data-center tenancy. Joule is examined in the Utah state rankings.
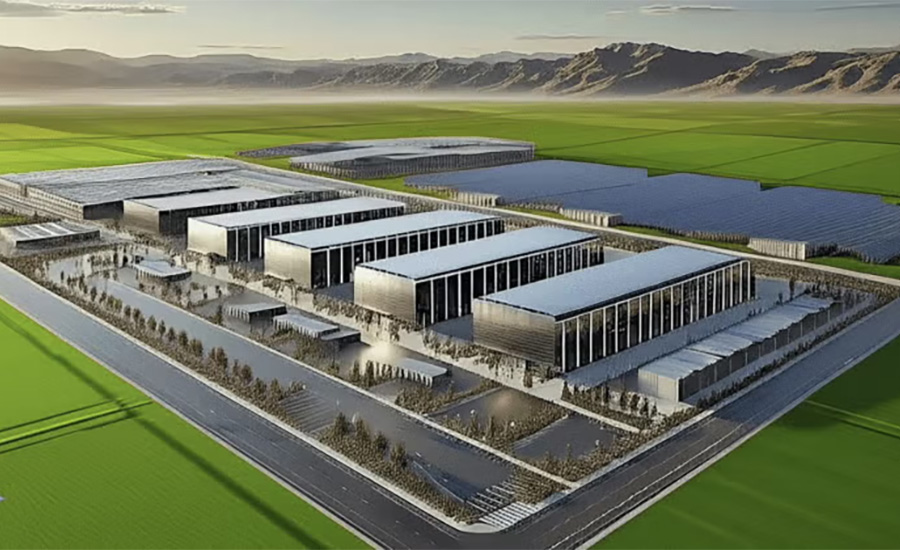
Its engineering merits should ultimately be judged by delivered power, usable waste heat, water consumption, air permits and operational efficiency.
8. Homer City Energy Campus, Pennsylvania — Up to 4.4 GW Planned Power
The redevelopment of Pennsylvania’s retired Homer City coal station is designed around up to 4.4 GW of natural-gas electricity generation for AI data centers and possible grid service. Some permitting and coverage use approximately 4.5 GW or a different equipment nameplate figure, illustrating how turbine ratings and project design assumptions can vary.
Site redevelopment and generating-plant work have advanced, but a prospective power plant is not the same as commissioned megawatts or leased data halls. Regulatory decisions, fuel contracts and connection arrangements will decide how much electricity can actually be delivered. More context appears in the Pennsylvania Top 3.
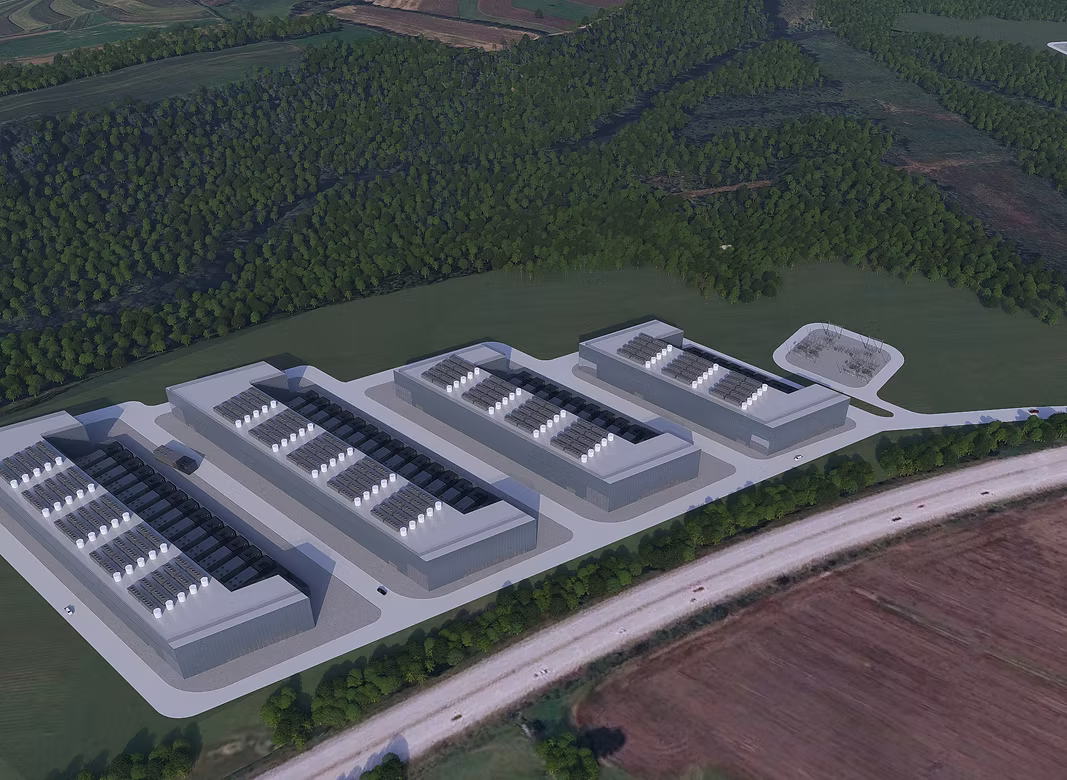
The project would be an important example of industrial-site reuse if its generating and computing plans reach commercial operation.
7. Meta Hyperion, Louisiana — 5 GW Planned Compute Capacity
Meta announced that its Richland Parish investment is being expanded toward 5 GW of compute capacity. Hyperion is already a major construction effort with associated transmission and electricity-supply work. The company’s target measures an eventual compute development scale, not proof of five gigawatts of operating servers in 2026.
Unlike an independent power producer, Meta is chiefly developing computing infrastructure and arranging the electrical service necessary to run it. The ultimate grid and generation mix should therefore be accounted for separately from the compute figure. The Louisiana state ranking describes how the project compares with other regional proposals.
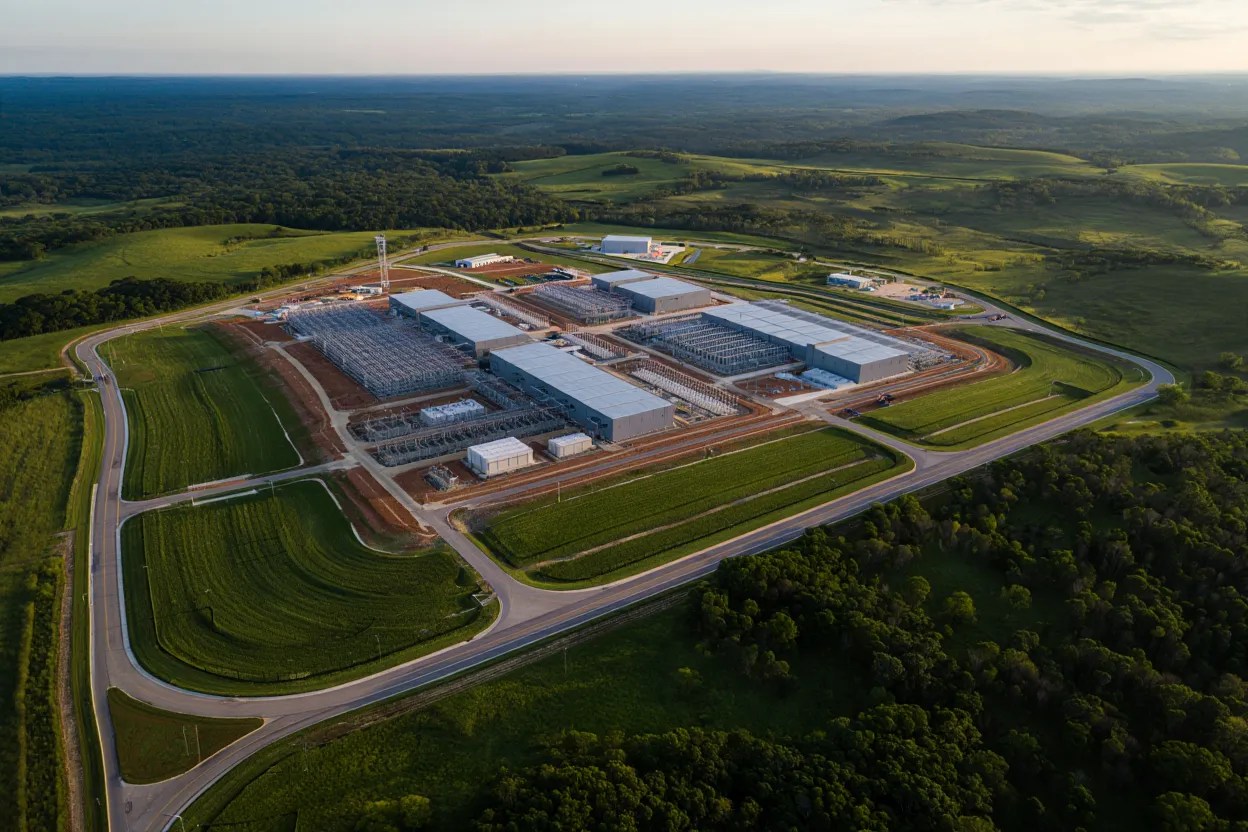
A useful next milestone would be a verified public accounting of installed IT megawatts alongside dedicated supply and transmission upgrades.
6. E2B4 Roswell Information Park, New Mexico — 6.5 GW Proposed Generation
E2B4’s proposed Roswell Information Park separates its engineering targets more clearly than many developers: its investor materials call for 6.5 GW of net islanded generation supporting 4,960 MW of critical IT capacity across 20 halls. That difference is important because the generators must also cover equipment losses, cooling requirements and reliability reserves.
The developer describes gas-supply access and a phased initial compute program, but the full buildout still depends on engineering, contracts, environmental permits and financing. The scale is a proposal, not installed generating capacity. The New Mexico state ranking compares Roswell with Project Jupiter and Meta Los Lunas.
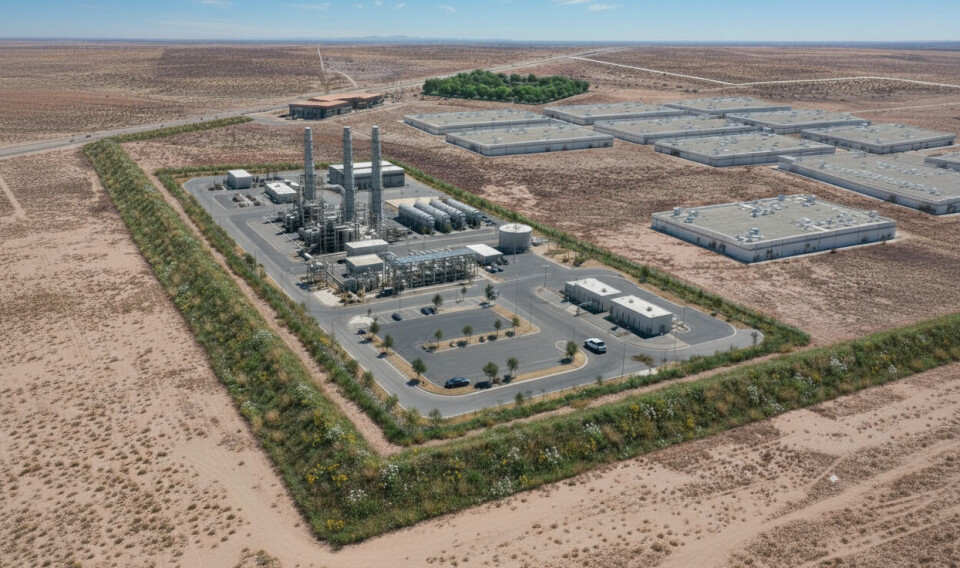
Its 6.5 GW generation figure is the value plotted in the national chart, rather than its lower 4.96 GW planned IT load.
5. Nscale Monarch Compute Campus, West Virginia — Over 8 GW Power Runway
Nscale’s proposed Monarch campus in Mason County has a long-term microgrid expansion runway exceeding 8 GW, according to its March announcement. The site has a state-certified development framework, but the large figure represents possible phased expansion rather than currently available electricity. Early project reporting described a much smaller roughly 2 GW first-phase ambition.
Gas generation, power delivery, data halls and customers would need to be built and contracted in stages. This creates a meaningful difference between a large permitted development zone and a reliable energy supply. The earlier West Virginia ranking also compares Monarch with the separate Tamarack and Ridgeline projects.
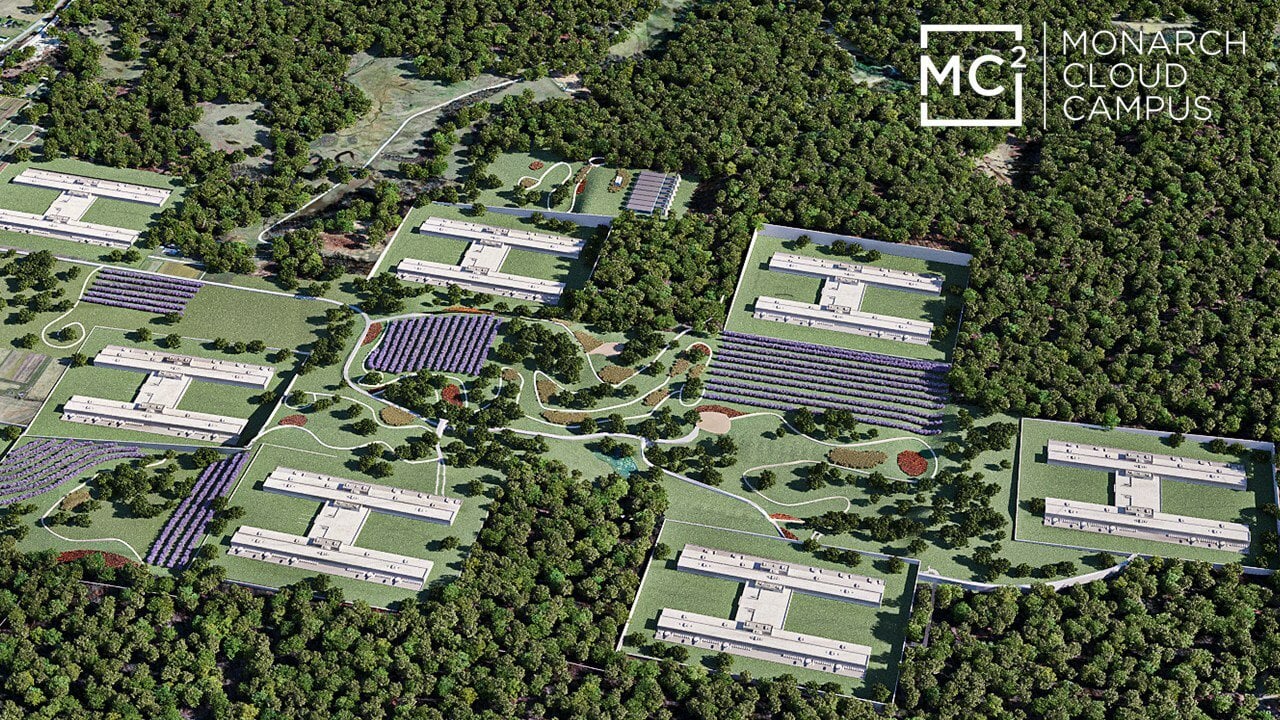
The headline 8 GW-plus figure is best read as a development ceiling whose eventual delivery depends on permitting, capital and secured equipment.
4. PORTS-Pike Technology Campus, Ohio — 8 GW Planned IT Load
OpenAI says its partnership with SB Energy, NVIDIA and the U.S. Department of Energy targets approximately 8 GW of critical IT capacity near Piketon, at and around the former Portsmouth uranium-enrichment site. That figure measures electricity intended for computing equipment; the corresponding facility-level power requirement would be greater after cooling, power distribution and other overhead.
NVIDIA initially backed 4.25 GW-IT of land, power and shell capacity, with an option tied to the remaining 3.75 GW-IT. Pike County describes phased future delivery and ongoing community agreements. The scale is extraordinary, but it is not eight gigawatts of power plants already available. The Ohio ranking distinguishes these commitments from 2026 energized load.
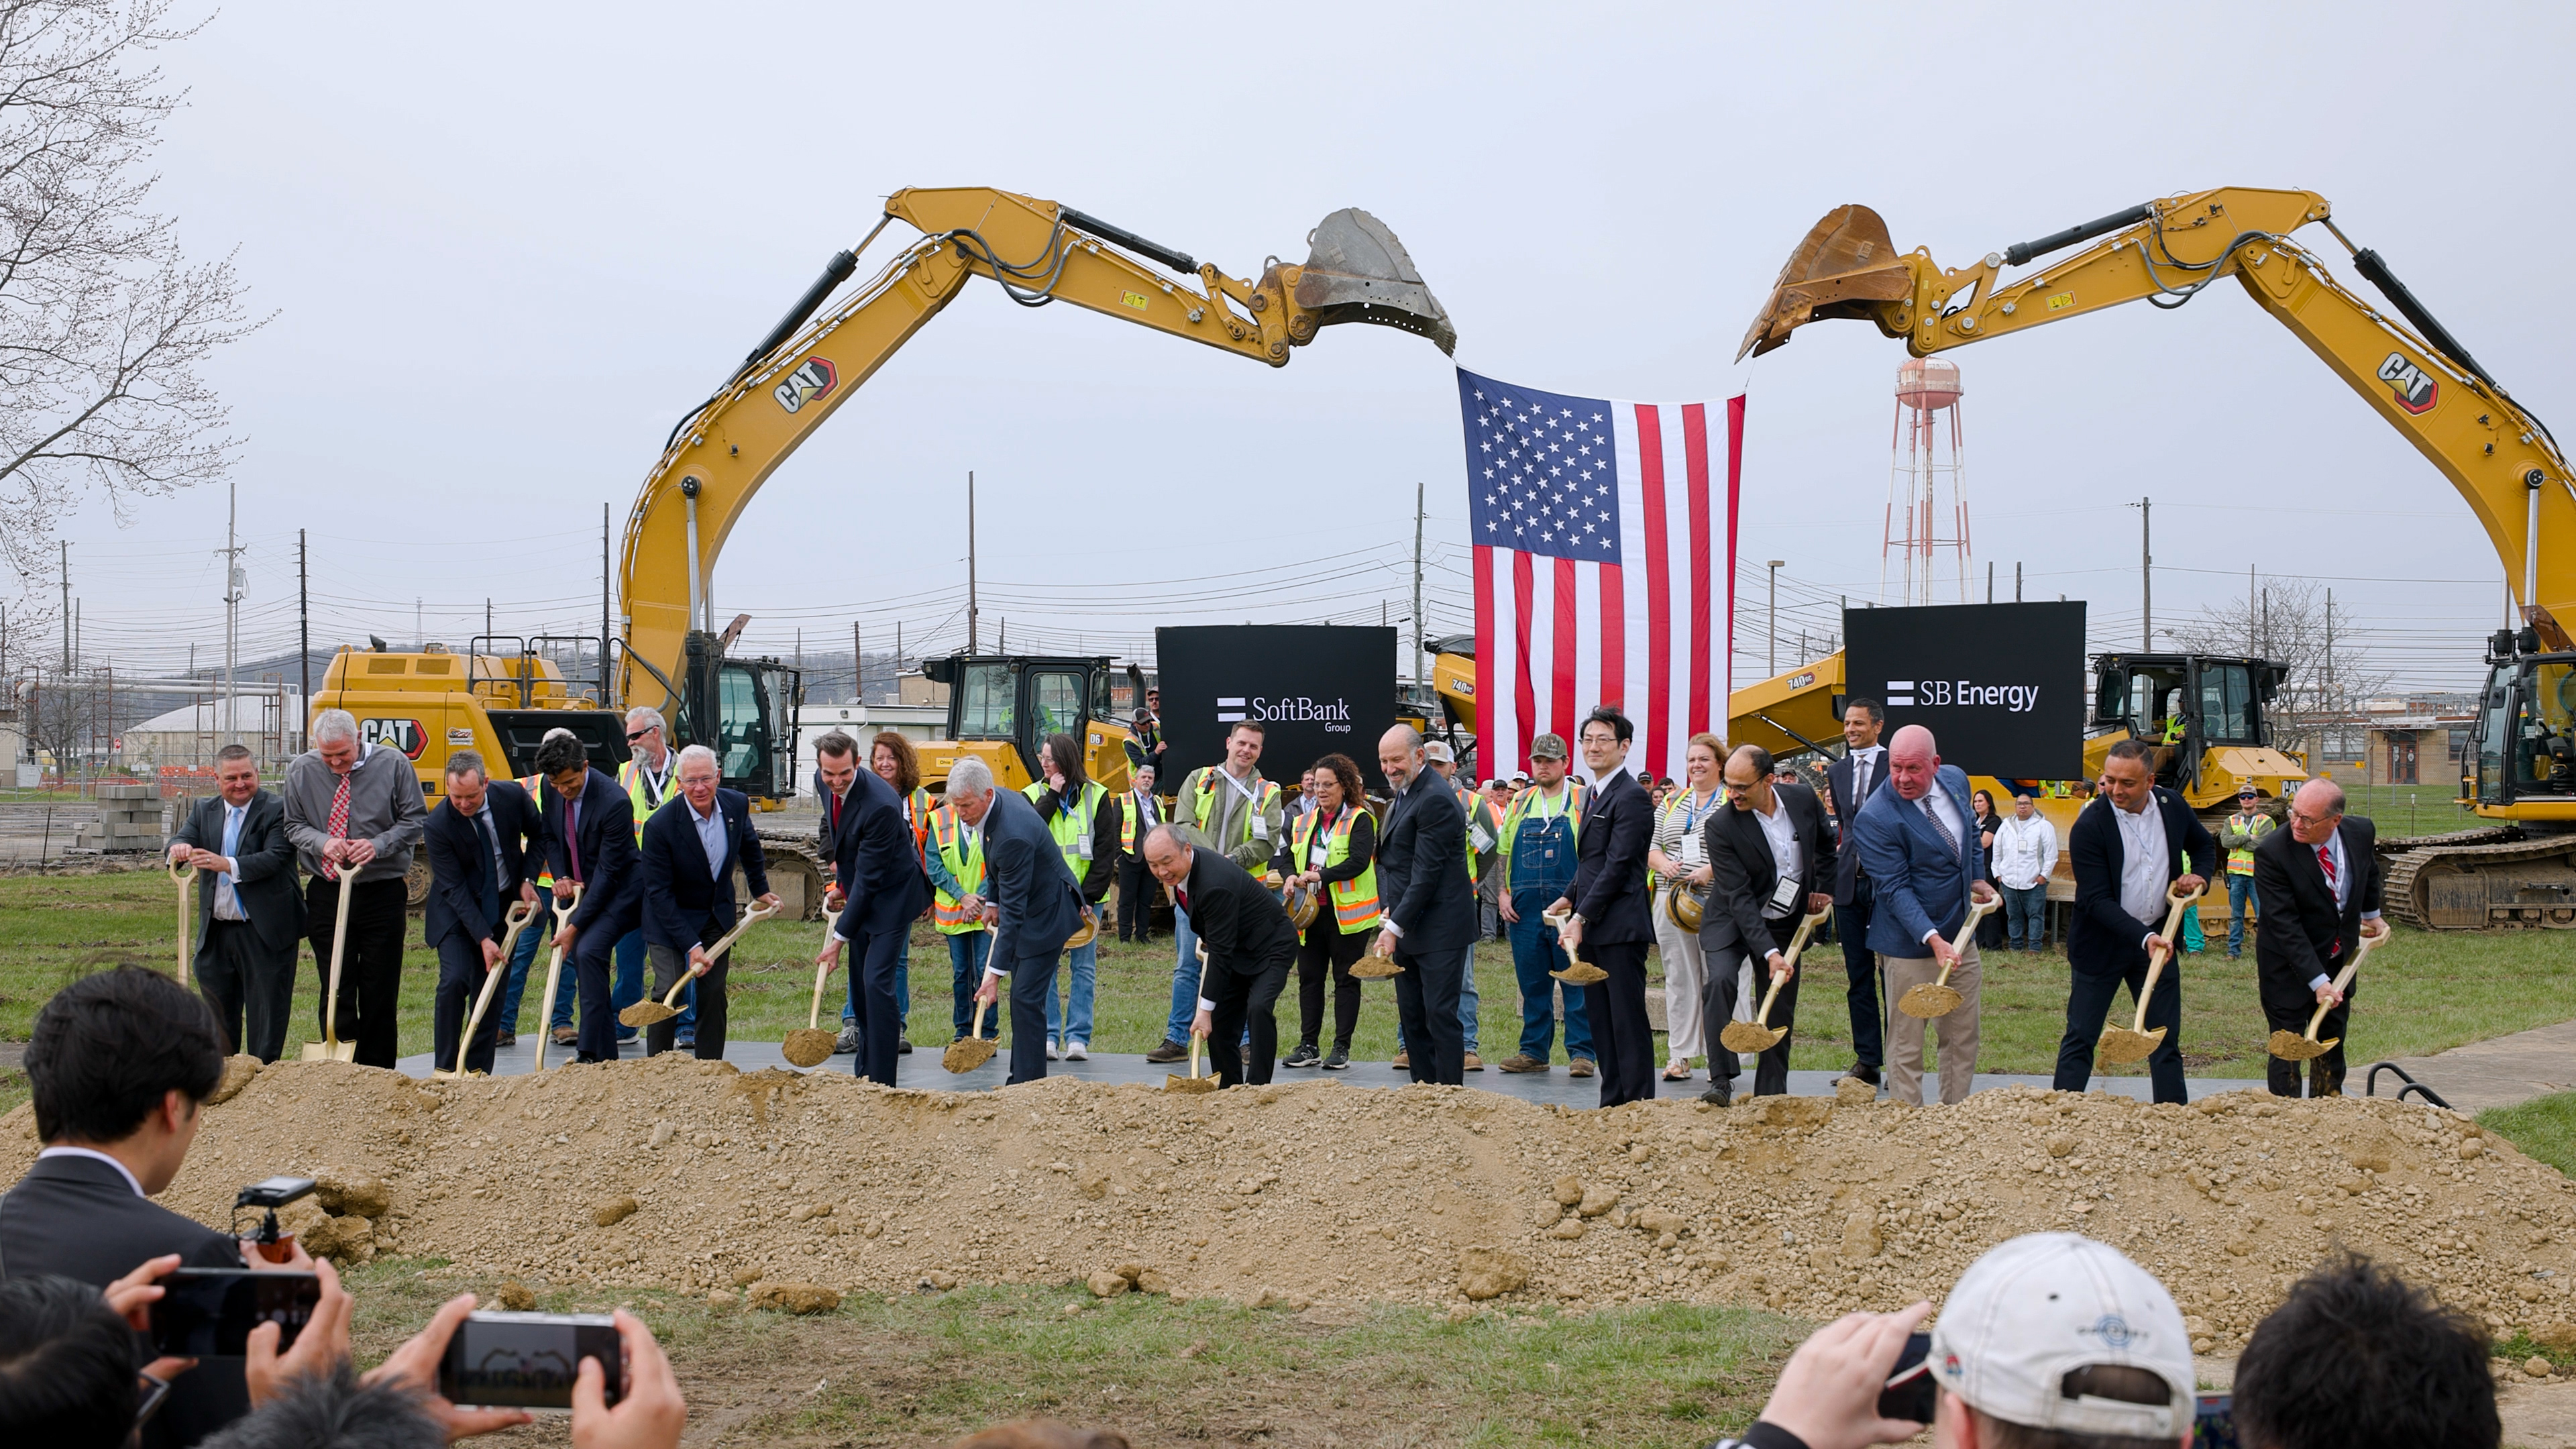
The most revealing future numbers will be completed substations, service contracts, installed cooling systems, and audited IT power in each commissioned phase.
3. Stratos / Wonder Valley, Utah — About 9 GW Long-Term Concept
The Stratos Project Area in Box Elder County has been described by Utah’s Military Installation Development Authority at approximately 9 GW of long-run project scale. The developer’s more detailed Wonder Valley Utah disclosure discusses approximately 7.5 GW over later stages, while an October water application outlines fifteen 500 MW natural-gas blocks.
The 7.5 GW detailed generation proposal should not be confused with the higher 9 GW development ambition. Local land-use actions have advanced, but air and water approvals, financing and actual plant construction remain central uncertainties. Those questions, including water sourcing and power-plant emissions, matter as much as the announced scale. The full Utah report documents the competing figures.

Video thumbnail from the April 27, 2026 Box Elder County commission meeting recording, which discusses the Stratos proposal and local oversight.
The project remains a proposed multi-stage development, not an operating 9 GW data center or power station.
2. Creekstone Delta Gigasite, Utah — More Than 10 GW Power Stack
Creekstone Energy says its proposed Delta Gigasite combines natural gas, solar and storage resources into a power stack exceeding 10 GW. The company’s breakdown includes 2.1 GW natural gas and 6 GW solar, along with storage and other resources. Storage capacity and intermittent solar nameplate output are not the same as continuous round-the-clock generation.
The site has industrial zoning, an executed gas interconnect agreement and initial work in progress. Creekstone’s own compute specifications separately cite approximately 4.61 GW of HPC load. These distinctions are why a 10 GW power stack must not be presented as ten gigawatts of functioning computers. See the Utah ranking.
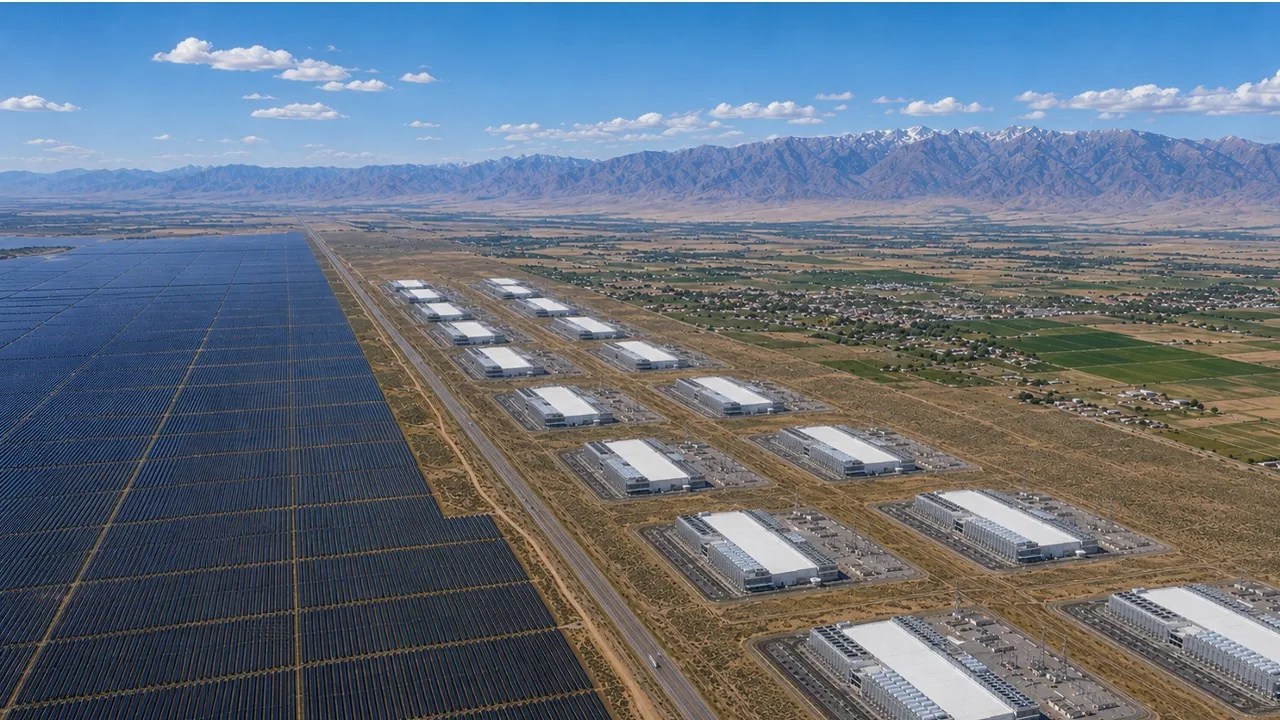
Future reporting should isolate dispatchable gas generation, solar nameplate capacity, energy-storage power and duration, and the megawatts actually delivered to tenants.
1. Fermi Project Matador, Texas — 11 GW Power Campus
Fermi’s Project Matador near Amarillo is pursuing a vast, phased mix of natural gas, potential nuclear generation and grid-connected resources. The 11 GW headline describes an ultimate energy-campus design rather than installed power plants or operating data halls. Fermi’s latest annual report retains an 11 GW goal for the principal campus while describing possible expansion on additional acreage.
A 222 MW proposed TensorWave tenant arrangement is much smaller than the full master plan, and its closing had been extended to October 31. Fermi has disclosed delays to its earlier power-ramp schedule. That means the most significant near-term measures are a closed tenant agreement, financed construction, equipment commissioning and real megawatts available for use. The Texas Top 7 examines these stages in detail.
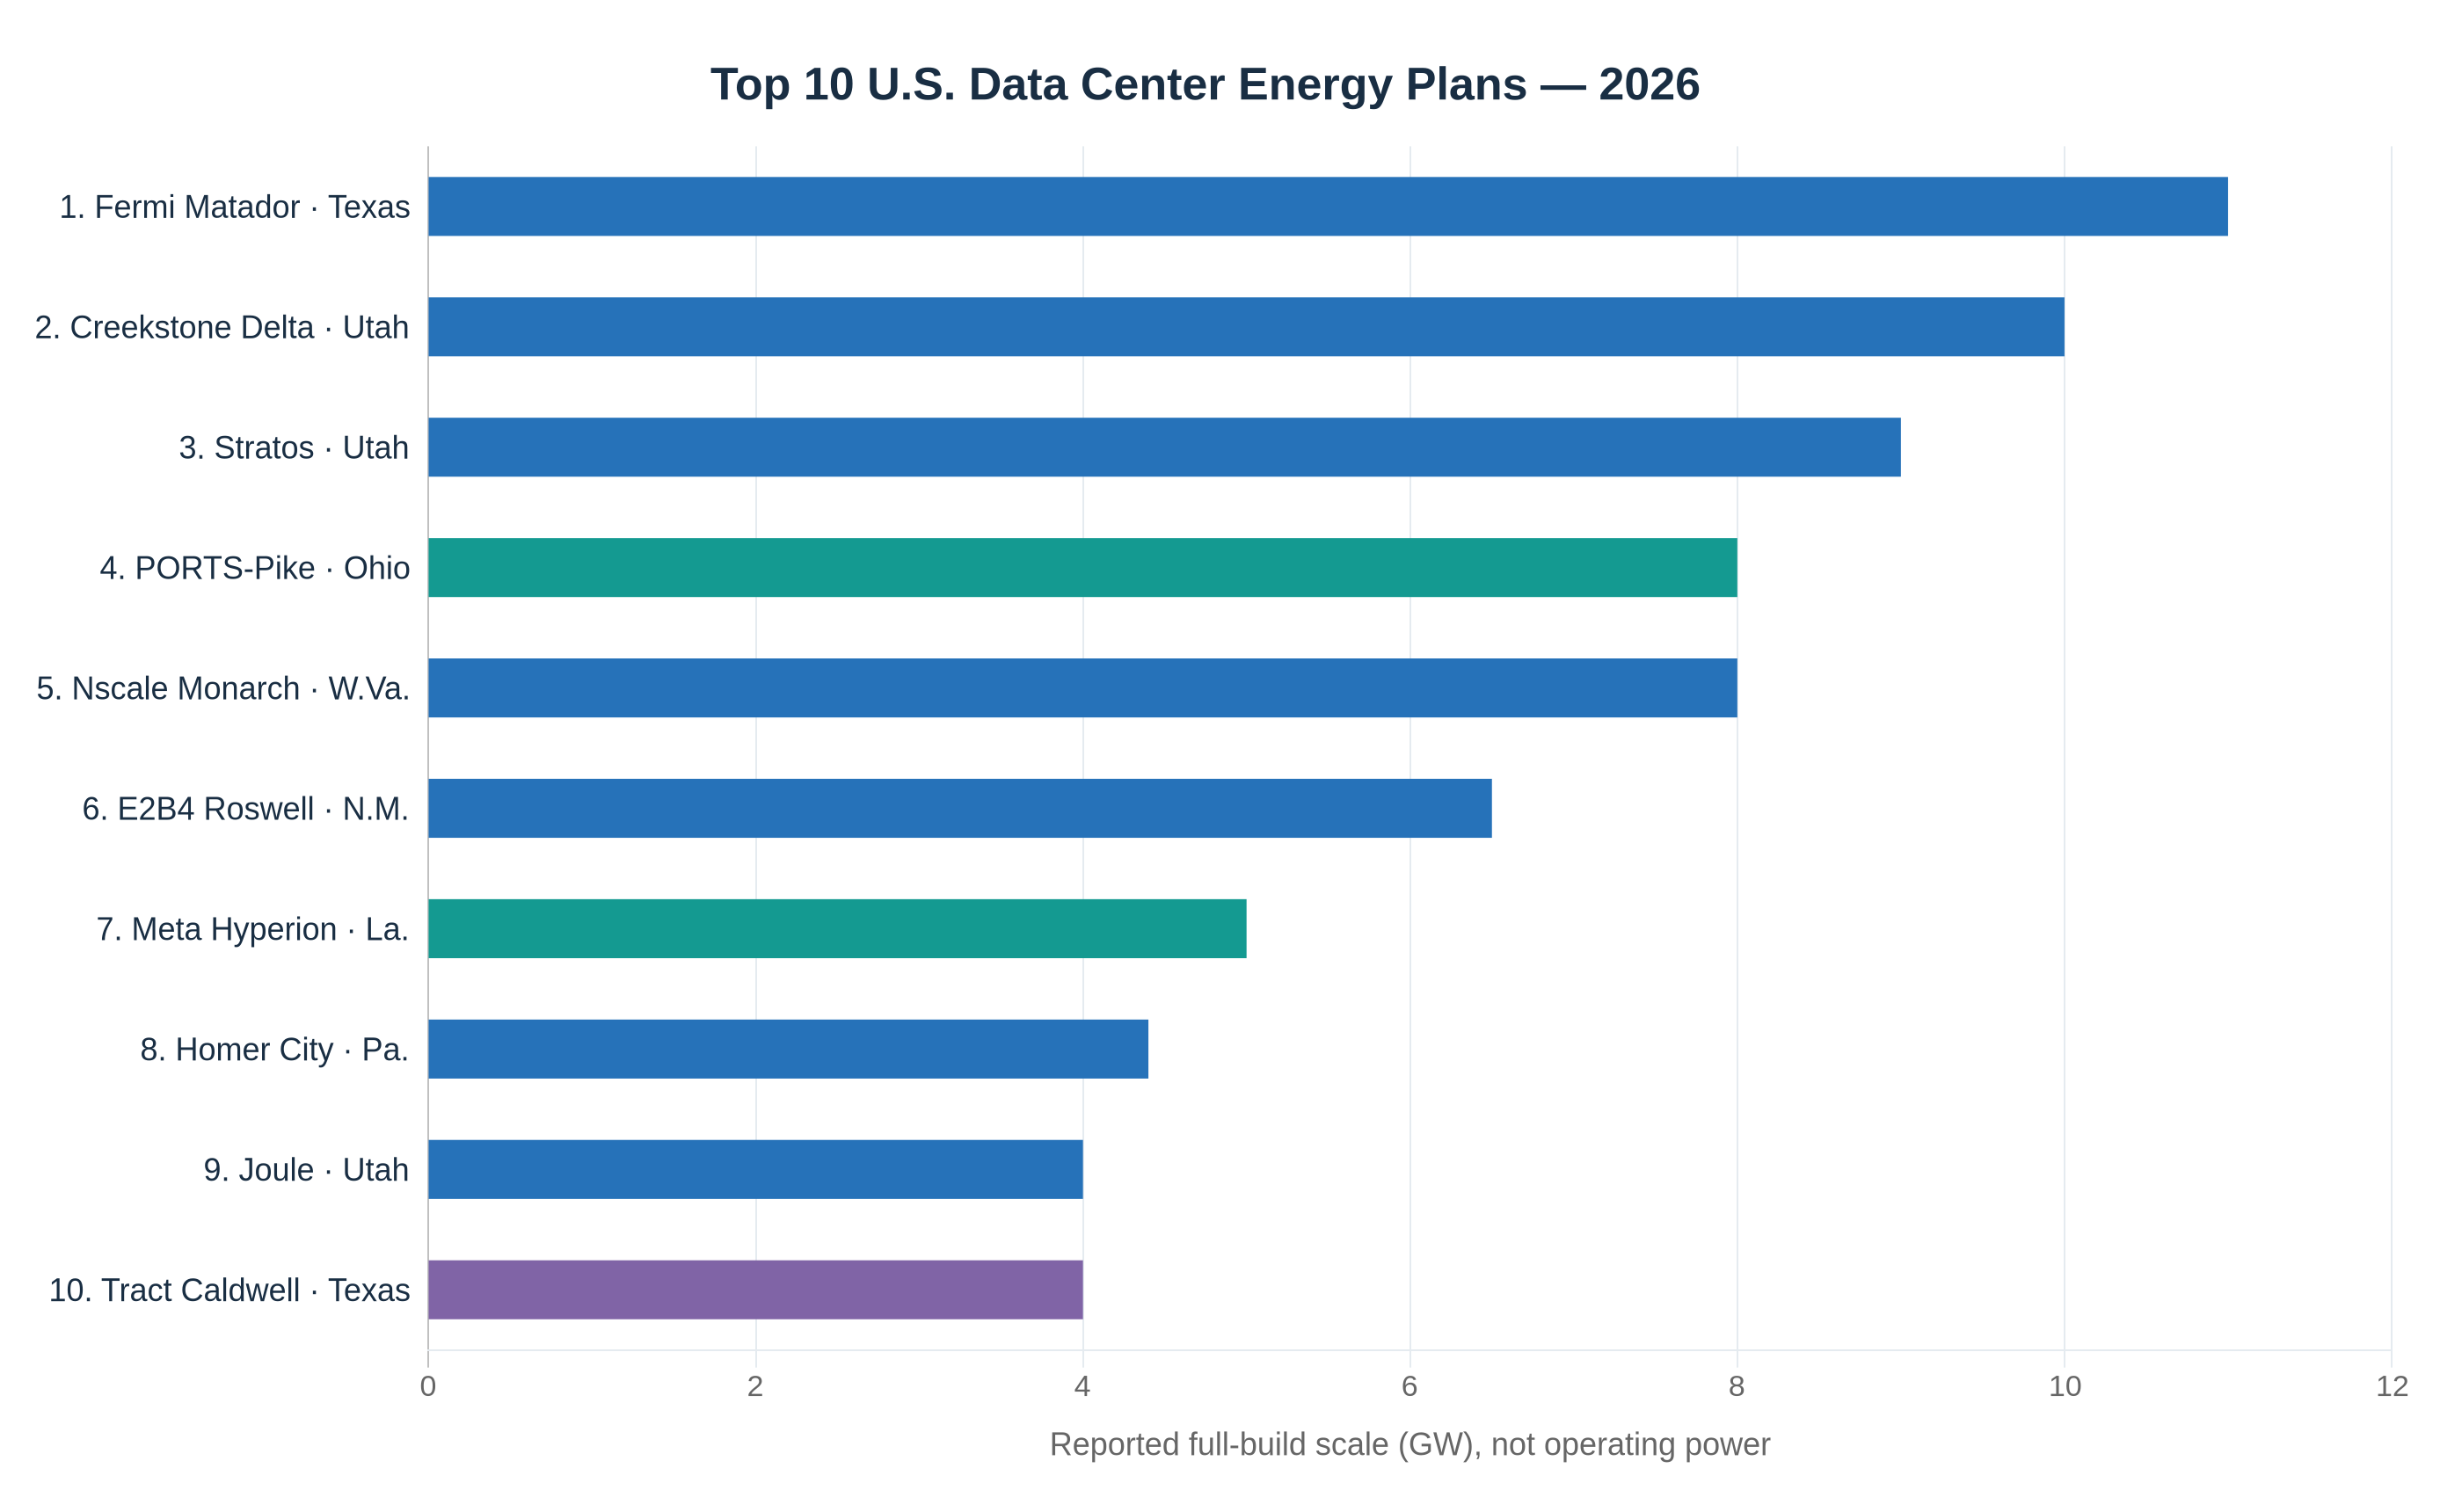
The full chart design and methodology notes are also available in the Chart Atlas. The chart measures the magnitude of disclosed ambitions, not the probability that each buildout will finish.
Why These Power Figures Require Careful Reading
The chart is a ranking of reported full-build development scale, not ten operating power plants. In particular, the 10 GW plotted for Creekstone is a conservative marker for a claim above 10 GW; Stratos’s roughly 9 GW long-term concept includes a more detailed 7.5 GW gas plan; and the 8 GW for PORTS-Pike is critical IT demand, not generator output. Nscale’s 8 GW-plus figure is an expansion aspiration. A generating plant’s output and a data center’s gross or IT demand cannot be added as though they were separate electricity consumption.
This is also why we excluded larger speculative extensions not consistently part of the state rankings, such as possible additional Fermi acreage or a separate nuclear concept. Gigawatts planned, megawatts under contract, assets under construction and electricity actually energized need distinct tracking. Our data center capacity-planning lesson examines those differences.
BitcoinVersus.Tech
BitcoinVersus.Tech Editor’s Note: We volunteer daily to ensure the credibility of the information on this platform is Verifiably True. If you would like to support our work and help further secure the integrity of our research initiatives, please scan the QR code below to donate 5,000 sats. For best results, scan the QR code from a laptop or larger screen.
Bitcoin address: 3C9o19EH5HSiwEPyCTmEKzxhNCbo2X6TTb. On a phone, open the QR image on another screen or copy and verify the address in your wallet before sending.

BitcoinVersus.tech is not a financial advisor. This media platform reports on financial subjects purely for informational purposes.


Leave a Reply