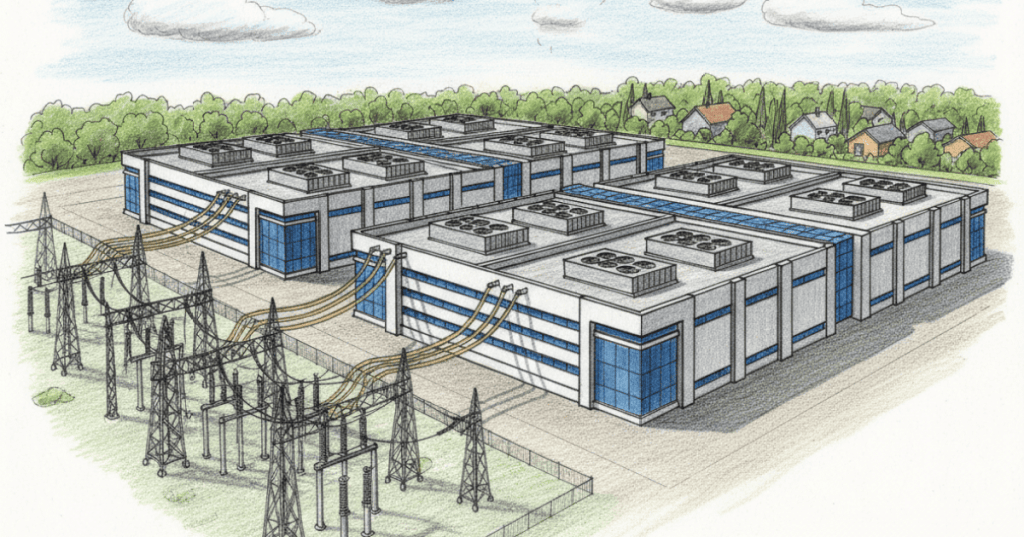
Data center capacity planning is the engineering discipline of translating expected IT demand into safe, resilient and financially justified infrastructure capacity. It coordinates compute, electrical distribution, cooling, floor space, network connectivity, procurement lead times and facility expansion. This chapter follows rack PDU load balancing and the previous thermal modeling and field validation lesson, extending component-level measurements into multi-year engineering forecasts.
Demand forecasting and the capacity baseline
An engineering forecast starts with an auditable baseline: installed servers and racks, measured IT power, committed workloads, observed utilization, redundancy requirements, cooling capacity, usable white space and upstream utility limits. Future demand should be separated into contracted growth, likely growth and speculative opportunities. Engineers often produce low, central and high scenarios instead of treating one forecast as certainty. Source data may include facility meters, intelligent PDUs, building-management systems, asset records and business demand plans.
Power, space, cooling and network are separate constraints
A data center with spare rack units may lack electrical headroom. A facility with spare transformer capacity may still have inadequate cooling distribution or constrained fiber paths. Engineers must model each limiting resource independently and use the most restrictive verified bottleneck when defining deliverable capacity. A planned megawatt of utility service is not necessarily a megawatt of usable IT load after distribution losses, auxiliary loads and redundancy constraints.
Power usage effectiveness and IT power
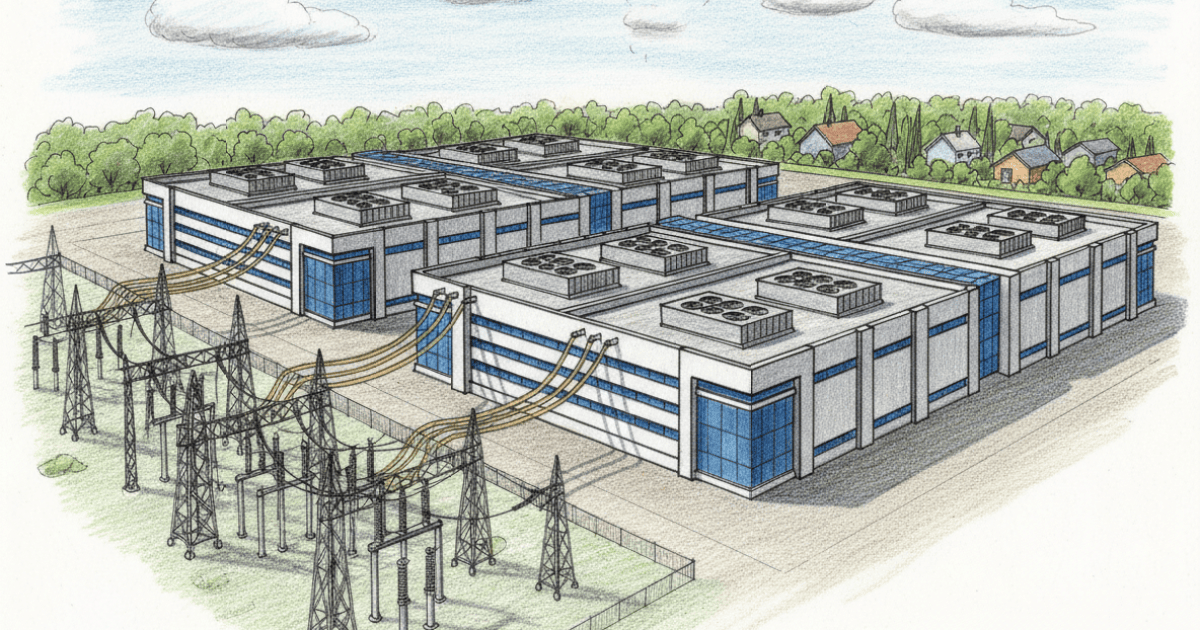
Power usage effectiveness (PUE) is the ratio of total data center facility energy to IT equipment energy measured over the same period and with consistent boundaries. For a simplified steady-state illustration, a 10 MW IT load with PUE 1.25 implies approximately 12.5 MW total facility power at that operating condition. PUE does not describe the distribution of cooling or electrical losses, and a single snapshot is not equivalent to a full-year energy-weighted PUE. The Green Grid publishes the original framework and industry guidance.
Redundancy and failure-mode capacity
N, N+1, 2N and other resilience architectures describe different design approaches and cannot be reduced to one universal reserve percentage. A facility’s installed nameplate capacity may exceed the capacity available while maintaining required fault tolerance. For example, two 5 MW independent paths may support a 5 MW protected load in a 2N configuration, not automatically 10 MW of protected IT demand. The correct interpretation depends on topology, maintenance bypasses, upstream sources and the facility’s design basis.
Worked forecast: demand and efficiency
Suppose a facility currently needs 8 MW of IT power. Workload demand increases 20% annually while useful compute delivered per watt improves 10% annually. If these assumptions apply consistently, net IT-power demand grows by a factor of 1.20 / 1.10 ≈ 1.0909 per year, or approximately 9.1% annually—not exactly 10%. After two years, modeled IT power is 8 × (1.20 / 1.10)² ≈ 9.52 MW. This is a hypothetical example, not a forecast for any named facility. Efficiency improvements may be offset by new workload types, higher utilization, accelerated hardware replacement or demand expansion.
If the engineering policy permits a maximum normal utilization of 80% of the relevant deliverable IT capacity, supporting 9.52 MW requires at least 9.52 / 0.80 ≈ 11.90 MW of deliverable capacity under the policy’s defined conditions. That 80% is an illustrative planning reserve, not an electrical-code rule or universal industry standard. Additional contingency may be needed for discrete equipment increments, maintenance scenarios and delayed commissioning.
Equipment lead times and phase planning
Capacity expansion is constrained by the longest critical path, which may include utility interconnection, transformers, switchgear, UPS modules, generators, chillers, liquid-cooling distribution, network equipment or construction permits. Planning should distinguish purchase-order date, factory acceptance, delivery, installation, commissioning and production acceptance. A delivery milestone does not prove a site is ready to carry load. Engineers can phase projects to align capacity with credible demand while preserving the final design’s safety and redundancy requirements.
Lifecycle and stranded-capacity risk
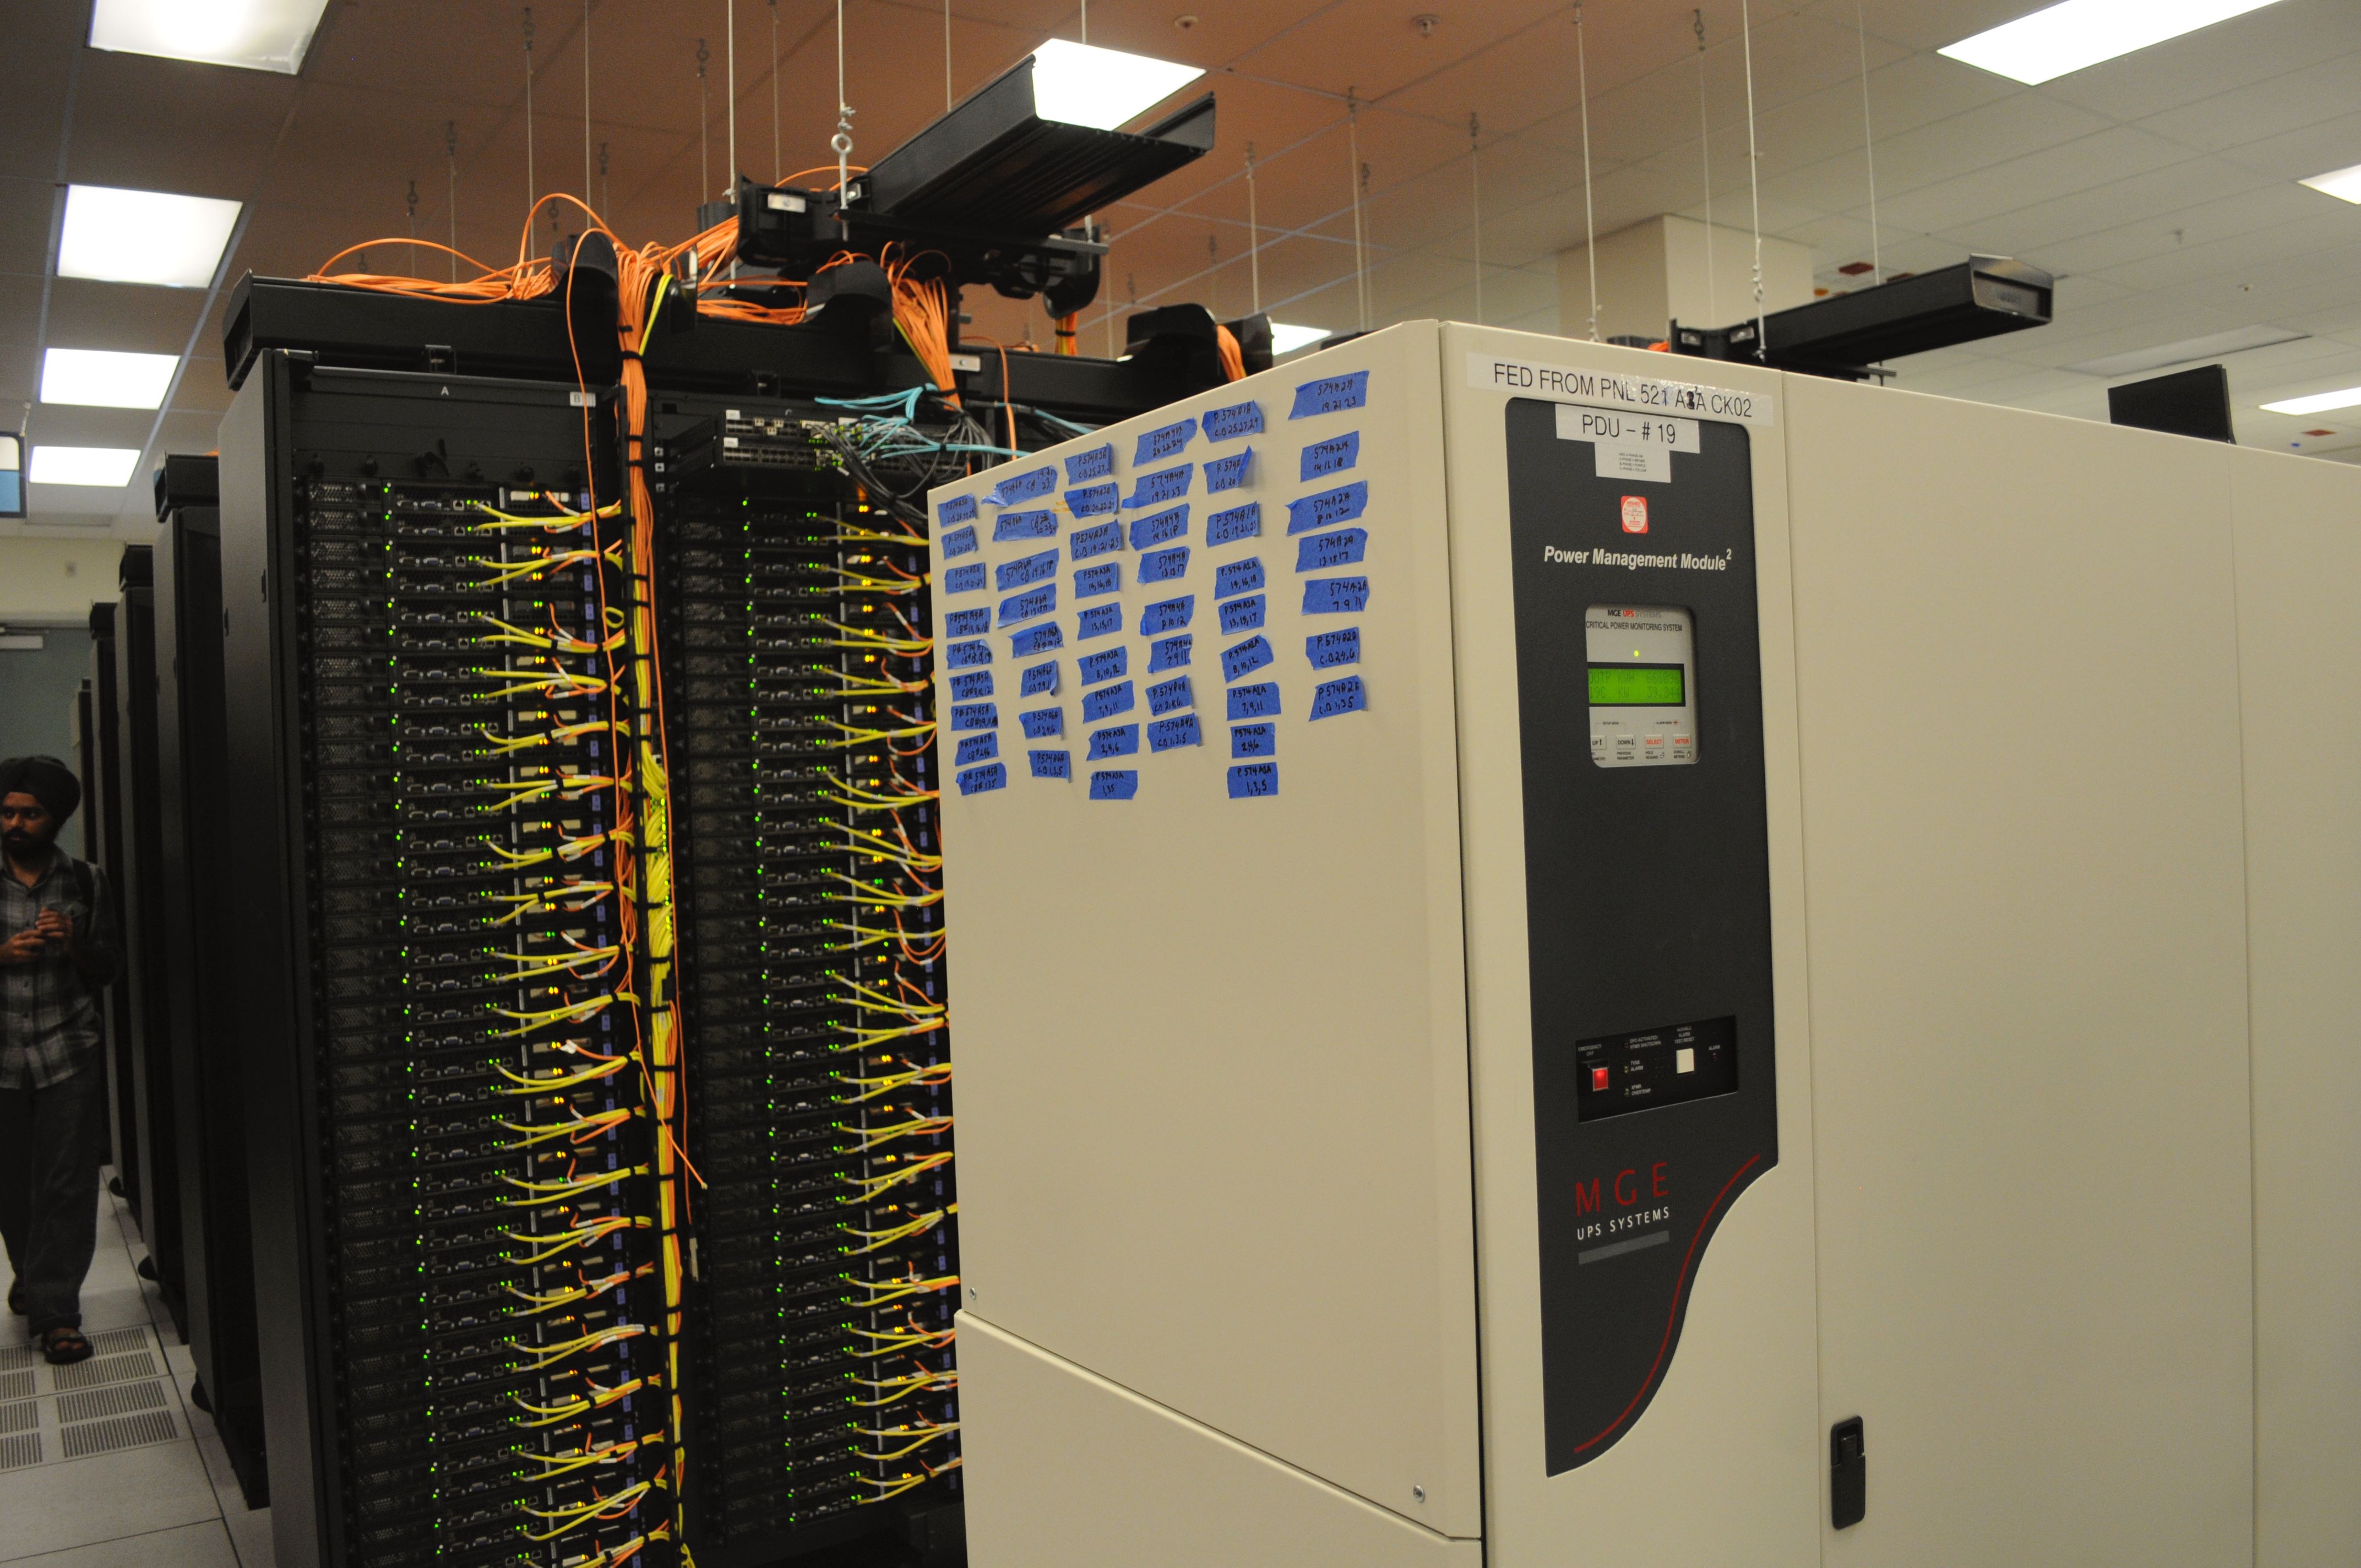
Hardware refreshes change power density, airflow requirements, network bandwidth, rack weights and sometimes cooling technology. A rack planned for low-density equipment may be incompatible with a later high-density accelerator deployment. Likewise, prematurely purchasing infrastructure can strand capital if the expected workloads do not materialize. Lifecycle forecasts should track equipment age, supportability, warranty, replacement cycles, energy efficiency, depreciation and the practical ability to repurpose equipment.
Governance, dashboards and decision records
A useful capacity dashboard distinguishes installed, commissioned, available, reserved and forecast capacity; it should never present these as interchangeable. Track forecast accuracy, utilization by constraint, time to exhaust, risk-adjusted expansion dates, commissioning progress and cost per deliverable unit. Decision records should document assumptions, measurement sources, confidence ranges, owners and change-control approvals. These practices connect to change control and UPS and battery engineering.
Engineering validation and uncertainty
A model should be reconciled with measured facility power, rack demand, cooling telemetry and real commissioning outcomes. If the predicted power headroom disagrees with PDU or UPS readings, investigate meter boundaries, sampling periods, equipment states and undocumented load changes. Use sensitivity analysis for demand growth, efficiency, supply lead times and allowable utilization. Avoid declaring a project fully funded, approved or deliverable based solely on a planning scenario.
Video study — capacity metering and power expansion
Schneider Electric Support demonstrates configuring a Power Usage Effectiveness report in Power Monitoring Expert. PUE is one input to capacity analysis; it is not a direct measure of protected IT headroom.
A second Schneider Electric video discusses modular power expansion for growing AI workloads. Use the presentation as an equipment-planning example and validate capacity claims against site-specific electrical design.
Knowledge check
Why is usable IT capacity smaller than some upstream nameplate ratings? How does a 20% workload growth rate combined with 10% compute-per-watt improvement translate into net power growth? What is the difference between commissioned capacity and reserved capacity? Why should an expansion schedule be tied to commissioning rather than shipment dates?
References and further reading
Consult The Green Grid, U.S. Department of Energy data center resources, Uptime Institute Tier framework and ASHRAE Datacom guidance. Related lessons include generator engineering, grounding and bonding and thermal modeling.
BitcoinVersus.Tech Editor’s Note: We volunteer daily to ensure the credibility of the information on this platform is Verifiably True. If you would like to support our work and help further secure the integrity of our research initiatives, please scan the QR code below to donate 5,000 sats.



Leave a Reply