
OSDCEC.013 — Data Center Thermal Modeling and CFD Validation. Engineers must predict whether a proposed rack layout, airflow path or cooling change will keep equipment inlet temperatures within their design envelopes. Computational fluid dynamics (CFD) helps test those hypotheses in a model; measured facility data is needed to determine whether the model deserves trust. This lesson follows OSDCEC.012 on generator engineering and builds on OSDCEC.003 on cooling fundamentals.
Learning objectives
- Explain what CFD predicts in a data hall and what it cannot prove alone.
- Identify boundary conditions, heat loads and airflow paths needed for a useful model.
- Calculate a simple model-versus-measurement error and plan a validation test.
1. Define the engineering question
A useful model begins with a decision: Will an added 12-kW rack create an unacceptable top-of-rack inlet temperature? Will a containment door or blanking-panel change reduce recirculation? Which sensor locations can validate the prediction? Avoid building a complicated model without a specific acceptance criterion.
2. Understand the physical room
CFD divides a physical volume into computational cells and estimates fluid flow and heat transfer using conservation equations. In a data center, the engineer must represent equipment heat release, server fan flow, cooling-unit supply and return paths, rack geometry, leakage, containment, obstructions and operating states. Inputs that are inaccurate can make a visually persuasive result misleading.
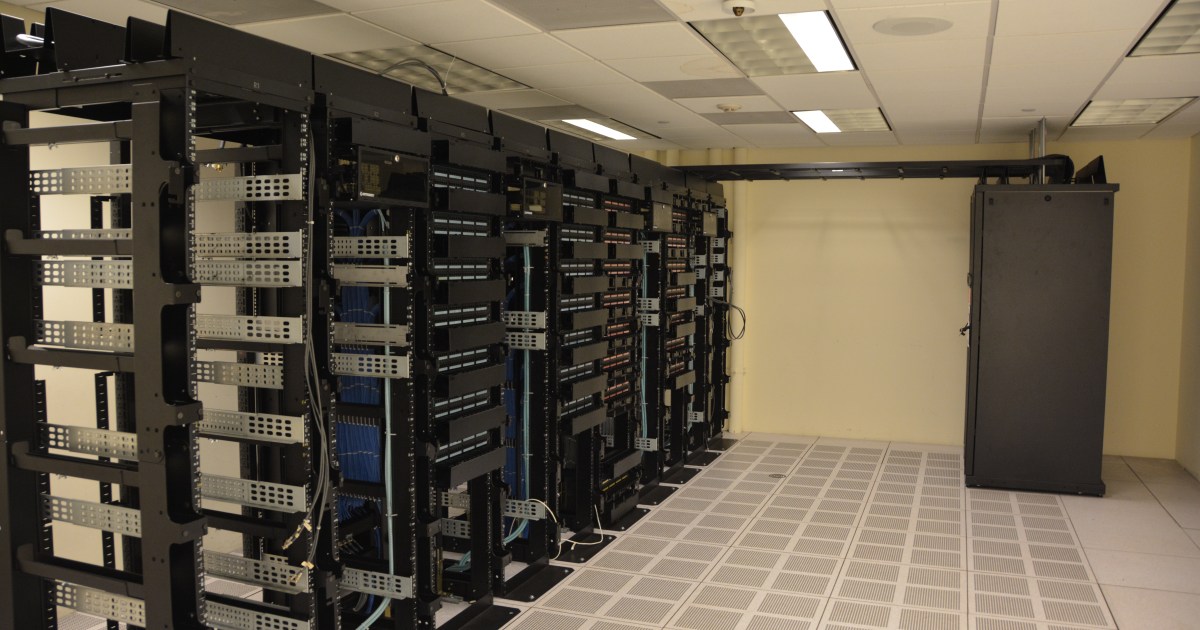
The following existing editorial image illustrates rack rows and the equipment geometry that a thermal model must represent. It is a photograph-style illustration, not a CFD result.
3. Build boundary conditions
- IT heat: Use measured or defensible per-rack power rather than nameplate maximum for an operating-case simulation; evaluate credible high-load scenarios separately.
- Supply air: Specify air temperature, flow rate and distribution from cooling equipment, perforated tiles or overhead delivery.
- Return paths: Include hot-aisle exhaust, return plenums and possible mixing between supply and return air.
- Rack resistance: Represent airflow impedance, doors, blanking panels and cable gaps where they materially affect results.
- Operating scenarios: Test equipment failures, maintenance modes or fan-control states when relevant to the design requirement.
Model assumptions should be traceable to drawings, commissioning data, equipment documentation and measured values. ASHRAE’s Datacom series provides the broader thermal design framework, while the U.S. Department of Energy’s data center design guide discusses efficient cooling practices.
4. Compare model output to the physical facility
A model is not validated simply because its colors look realistic. Compare predicted and measured inlet temperatures at corresponding physical positions, under documented load and cooling conditions. The field method in OSDCTC.014 describes top, middle and bottom rack-inlet measurements that can support this validation.
The next image shows a liquid-cooled rack at the U.S. National Renewable Energy Laboratory. Liquid-cooling configurations need different assumptions from a fully air-cooled rack, particularly when determining how much heat remains in room air.
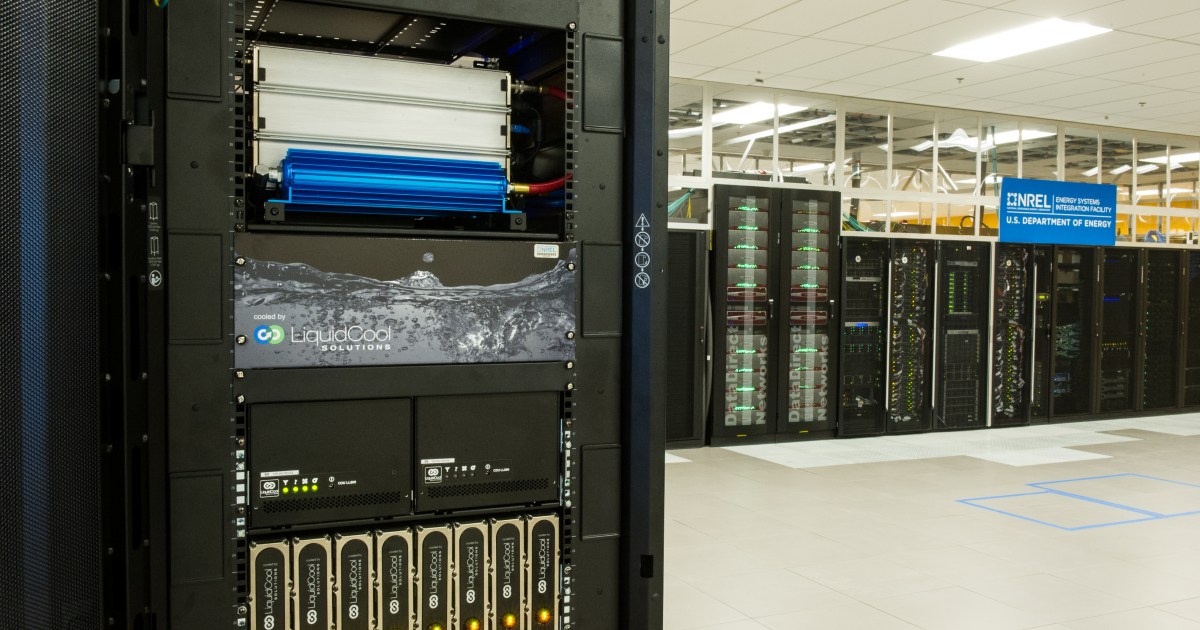
Image credit: U.S. Department of Energy / National Renewable Energy Laboratory, as identified in the existing BitcoinVersus.Tech media library. Review the NREL Energy Systems Integration Facility for context.
5. Worked example — quantify model error
An engineer models a rack’s three inlet locations and predicts 23.0°C at the bottom, 24.0°C in the middle and 26.0°C at the top. At a comparable load, calibrated field probes measure 22.5°C, 24.5°C and 28.0°C. The absolute errors are 0.5°C, 0.5°C and 2.0°C. The mean absolute error is (0.5 + 0.5 + 2.0) ÷ 3 = 1.0°C.
The mean alone hides a potentially important top-of-rack mismatch. The engineer should investigate upper-rack recirculation, door leakage, sensor location, supply distribution and model mesh quality before using this model to approve a capacity expansion. A suitable acceptance threshold must be established for the specific project, not invented after reviewing results.
6. Validation checklist
- Match model and field measurement locations, rack power and cooling conditions.
- Document instrument accuracy, sensor placement, sampling interval and data quality.
- Check mesh sensitivity and numerical convergence; a stable solver residual alone is not proof of physical accuracy.
- Test more than one representative operating condition and review worst-case hot spots.
- Record model version, assumptions, deviations and engineering sign-off before relying on predictions for operational decisions.
7. Knowledge check
- Why can two CFD models with similar-looking thermal plots yield different engineering decisions?
- What is the mean absolute error in the three-point example?
- Why should the top-of-rack mismatch be examined even when the mean error seems small?
Answers: Their heat loads, geometry, boundary conditions or assumptions may differ; 1.0°C; local hot spots can matter more than a roomwide average and may indicate a missed airflow path.
For connected lessons, revisit OSDCEC.002 on capacity planning, OSDCEC.005 on monitoring, and OSDCTC.013 on blanking panels.
BitcoinVersus.Tech Editor’s Note: Support independent data center engineering education with 5,000 sats. Scan the QR below using your Bitcoin wallet to contribute.

Display the QR on a second screen and scan it with a compatible wallet.


Leave a Reply