Elementary Overview
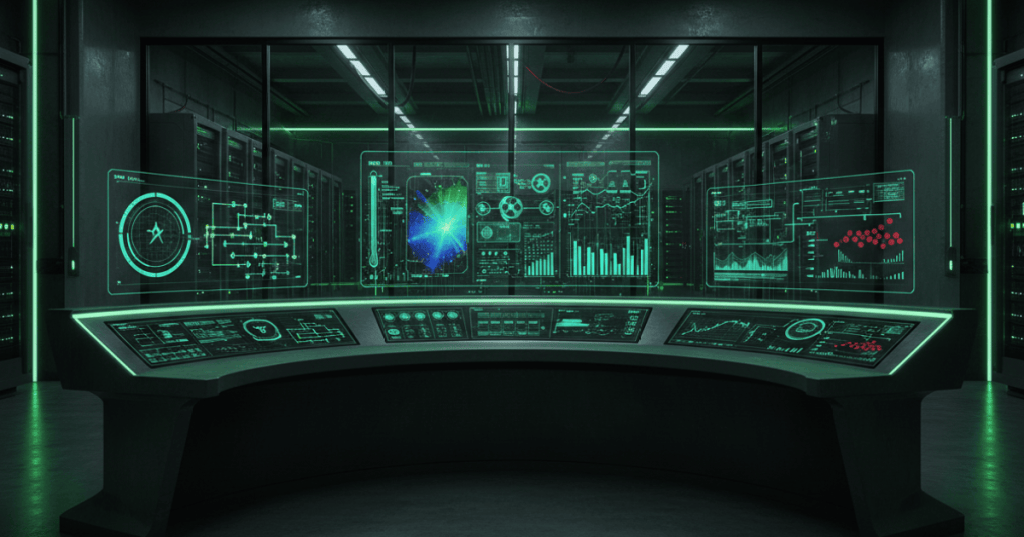
A data center cannot be operated safely by looking at equipment only when something breaks. Engineers need a continuous picture of power, cooling, environmental conditions, network-connected devices, and alarms. That picture is built from monitoring systems such as BMS, EPMS, and DCIM, plus device protocols such as SNMP and Modbus. The simplest mental model is a nervous system: sensors and devices report what is happening, software organizes the signals, alarms identify abnormal conditions, and operators respond before a small problem becomes an outage. This lesson builds on the power path in OSDCEC.004 and the cooling path in OSDCEC.003.
BMS, EPMS, and DCIM Have Different Jobs
A Building Management System usually focuses on mechanical and building systems such as HVAC equipment, pumps, valves, dampers, temperatures, humidity, pressure, and environmental sensors. An Electrical Power Monitoring System focuses on electrical measurements such as voltage, current, real power, energy, breaker state, UPS condition, generator condition, and power quality. Data Center Infrastructure Management software sits across these domains to give operators a broader operational view of racks, capacity, power, cooling, alarms, assets, and sometimes workflow. These systems can overlap, so engineers should define which platform is authoritative for each signal. A cooling alarm should not exist as three unrelated versions in three dashboards with different thresholds and different owners.
SNMP Brings Networked Device Telemetry Into the Monitoring Layer
Simple Network Management Protocol is widely used to read device status and counters from networked equipment. A monitoring manager queries an SNMP agent using identifiers defined in a MIB, while traps or informs can report events without waiting for the next poll. In a data center, SNMP can expose switch interface state, UPS status, rack-PDU current, environmental sensors, fan alarms, and many other values depending on the vendor. Engineers should prefer authenticated and encrypted SNMPv3 where supported, document community or credential handling, and avoid polling so aggressively that monitoring itself becomes unnecessary network load.
Modbus Connects Meters, Controllers, and Industrial Equipment
Modbus is common on electrical meters, UPS systems, generators, transfer switches, cooling equipment, PLCs, and sensors. Modbus RTU commonly rides over RS-485 serial wiring, while Modbus TCP carries similar register-based data across Ethernet. Values live in coils, discrete inputs, input registers, or holding registers, so an engineer must know the correct device address, register map, data type, scale factor, byte order, and units. A raw register value of 253 may mean 25.3 °C if the vendor defines a 0.1 scale factor. Incorrect scaling can create believable but wrong dashboards, which makes register-map verification part of commissioning.
Alarm Engineering Requires Thresholds, Delay, Deadband, and Severity
An alarm should tell an operator that action may be required, not merely that a number moved. Good alarm design defines a trigger threshold, a time delay, a clear condition, a deadband or hysteresis value when needed, a severity, an owner, and a response procedure. For example, a rack inlet temperature might alarm high at 27 °C only after remaining above that value for 60 seconds, then clear after falling below 25 °C. The 2 °C difference prevents rapid alarm chatter near the threshold. Severity should reflect consequence: an informational filter state is not the same as loss of an A-side UPS. Alarm floods are dangerous because operators can miss the one event that actually explains the failure.
Trending Turns Raw Telemetry Into Engineering Evidence
Instantaneous values answer “what is happening now,” while trends answer “what changed and when.” Engineers should trend the measurements that reveal system behavior: rack power, UPS load, branch current, supply and return temperature, pressure, humidity, fan speed, pump speed, valve position, generator run state, battery measurements, and device availability. Correlating signals often exposes cause and effect. If rack inlet temperature rises only after a cooling-unit fan command drops, the timeline is stronger evidence than either alarm by itself. Trending also supports capacity planning from OSDCEC.002, including PUE analysis where PUE = Total Facility Energy ÷ IT Equipment Energy.
Power and Cooling Telemetry Must Preserve Failure-Domain Context
A dashboard is useful only if the engineer can tell which physical path each point belongs to. Rack-PDU current should identify A or B feed, phase, branch, rack, and outlet group. UPS telemetry should identify module, bus, bypass state, battery state, and upstream source. Cooling points should identify the air handler, CDU, pump, loop, containment zone, or rack group they serve. That context connects live telemetry to the electrical one-line and cooling architecture. Without it, an operator may see “PDU overload” but not know whether the threatened load is a single rack, one power path, or an entire failure domain.
Incident Response Starts With a Timeline, Not a Guess
When an incident occurs, engineers should preserve the event timeline before clearing alarms. Record the first alarm, upstream and downstream state changes, related environmental values, device logs, operator actions, and the time service recovered. If a server group fails after a breaker trip, the investigation should also check the upstream bus, UPS, transfer state, rack-PDU current, cooling response, and network visibility. The recent hardware-troubleshooting method in OSDCTC.005 uses the same principle at the server level: symptom → evidence → suspect → one change → verification. Monitoring systems scale that method to an entire facility.
Worked Example: Rack A12 High-Temperature Alarm
- Alarm: rack inlet temperature > 27 °C for 60 seconds.
- Clear point: below 25 °C.
- First check: confirm sensor validity and compare nearby rack sensors.
- Cooling correlation: inspect supply-air temperature, fan command, fan feedback, valve position, pressure, and containment state.
- Power correlation: check whether rack power recently increased and whether the A/B feeds remain normal.
- Trend window: review at least several minutes before the first alarm and continue through recovery.
- Response: correct the physical cause, verify temperatures recover, then document the incident timeline and final state.
Engineering Checklist
- List every BMS, EPMS, DCIM, network-monitoring, and equipment-management platform.
- Define the authoritative system for each signal and alarm.
- Document SNMP versions, MIBs, credentials, polling intervals, and trap destinations.
- Document Modbus addresses, register maps, data types, scaling, byte order, and units.
- Map each electrical and cooling point to its physical failure domain.
- Define alarm threshold, delay, clear point, deadband, severity, owner, and response.
- Trend critical power, cooling, environment, and availability points at useful intervals.
- Verify time synchronization so alarms and device logs can be correlated.
- Test communication-loss alarms as well as process alarms.
- Commission dashboards against field measurements before trusting them operationally.
- Preserve event timelines during incidents and review them after recovery.
Exercises
- Explain the operational difference between BMS, EPMS, and DCIM.
- Describe how an SNMP manager, agent, MIB, poll, and trap fit together.
- A Modbus register returns 742 with a 0.1 scale factor. What engineering value should the dashboard show?
- Design a high-temperature alarm with threshold, delay, clear point, severity, and owner.
- List five signals you would trend to investigate a hot aisle temperature event.
- Explain why A/B electrical labels must remain visible in monitoring software.
- Write a short incident timeline using alarms, trends, and operator actions.
Knowledge Check + Answers
- What does a BMS mainly monitor and control? Building and mechanical systems such as HVAC, pumps, valves, and environmental conditions.
- What does an EPMS mainly monitor? Electrical measurements, source state, breakers, UPS systems, generators, power quality, and energy.
- What is SNMP used for? Reading status and counters from networked devices and receiving event notifications.
- What is a common difference between Modbus RTU and Modbus TCP? RTU commonly uses serial RS-485, while TCP transports Modbus messages over Ethernet.
- Why use deadband or hysteresis? To prevent alarms from rapidly toggling near a threshold.
- Why trend data? To reveal changes over time, correlate events, establish baselines, and support root-cause analysis.
- What should happen before clearing incident alarms? Preserve the event timeline and relevant evidence.
Elementary Conclusion
Monitoring turns a data center from a collection of machines into a system that operators can understand. BMS watches building and cooling behavior, EPMS watches electrical behavior, DCIM combines infrastructure information, and protocols such as SNMP and Modbus carry measurements from devices into those systems. Alarms tell people when action may be needed, while trends show what happened before and after the alarm. The engineer’s job is to make sure every value is correct, every alarm has meaning, every signal is tied to the right physical equipment, and every incident leaves enough evidence to explain what actually happened.
BitcoinVersus.Tech
Editor’s Note:
We volunteer daily to keep the technical information on this platform verifiable. Readers who want to support the research can use the donation information published by BitcoinVersus.Tech.
BitcoinVersus.tech is not a financial advisor. This media platform reports on financial subjects purely for informational purposes.


Leave a comment