
OSDCEC.016 examines electrical power quality in mission-critical data centers: short-duration voltage sags, persistent waveform harmonics, total harmonic distortion (THD), power-quality instrumentation, and the limits of UPS conditioning. Maintaining nominal voltage at a distribution board does not guarantee that server power supplies, switchgear, controls and cooling equipment see appropriate waveforms during disturbances. A well-designed investigation identifies what changed, where it was measured, how long it lasted and whether affected loads exceeded their documented operating envelope.
The lesson follows OSDCEC.015 on protective-device coordination. Fault clearing can coincide with voltage disturbances, but selectivity and power quality are distinct engineering questions. Related prerequisites include electrical power paths, UPS engineering, and data-center monitoring and controls.
Learning Objectives and Prerequisites
- Define voltage sag, swell, interruption, transient and harmonic distortion without treating the events as interchangeable.
- Convert RMS voltage measurements into per-unit magnitude and compute the percentage and duration of a sag.
- Calculate current THD from harmonic RMS components and distinguish current THD from total demand distortion (TDD).
- Identify measurement boundaries at utility service, switchgear, UPS input/output, PDU and critical IT distribution.
- Explain why UPS architecture, transfer characteristics and upstream/downstream settings must be checked rather than assuming perfect immunity.
- Interpret a source-labeled power-quality chart and distinguish synthetic educational numbers from field measurements.
- Specify which event records, meter configuration fields, and escalation evidence belong in an engineering investigation.
Prerequisites: AC waveforms, RMS voltage and current, three-phase electrical distribution, basic transformer and UPS operation, engineering units, and interpreting time series. Training requires only a notebook or spreadsheet and access to manufacturer documentation. No energized electrical equipment is required or authorized for the exercises.
Power Quality and Data Center Availability
Power quality describes voltage, current, frequency and waveform characteristics as observed at a defined location and time. In an idealized 60 Hz supply, voltage is a sinusoidal waveform at a stable magnitude and frequency. Real electrical distribution systems also experience fluctuations from faults, switching, non-linear loads, large motor starts, control interactions and network conditions. The Schneider Electric 2025 Power Quality eGuide for Data Centers discusses voltage variations and harmonic distortion as potential threats to operational continuity.
Equipment does not respond identically to every disturbance. A server power supply may ride through a brief input dip using stored energy. A cooling-system drive, utility relay, control transformer or UPS bypass path may have different thresholds. Engineers must evaluate the disturbance against each affected component’s published limits and the actual topology, not assume all assets see the same quality at the same instant.
Schneider Electric, “Understanding Power Quality” (September 7, 2018). The manufacturer’s freely accessible educational video discusses harmonics, power factor, flicker, voltage deviations and voltage-sag mitigation. Manufacturer explanations are background learning, not proof of any particular site’s measured condition.
Voltage Sags, Swells, Interruptions and Transients
A voltage sag is a temporary reduction in RMS voltage. An IEEE Industry Applications Society-hosted 2025 data-center power-quality training presentation, summarizing IEEE 1159, describes sags from 0.1 to 0.9 per unit over approximately one-half cycle to one minute. A swell is a short-duration voltage increase. An interruption means a much deeper loss of RMS voltage, not merely an elevated percentage THD. Transients are faster disturbances, including impulse-like events, and should not be classified as harmonic distortion solely because they alter waveform shape.
Per-unit voltage normalizes a reading to its defined reference: Vpu = Vmeasured RMS / Vreference RMS. Both voltages must refer to the same phase/line convention and measurement point. An installation nominally rated 480 V line-to-line, for example, cannot be evaluated using a measured 277 V line-to-neutral reading in the numerator unless the reference is converted accordingly.
Worked Example: A Short Sag at a 480 V Bus
Consider a hypothetical 480 V three-phase bus. A disturbance recorder captures the same measured line-to-line quantity falling to 408 V RMS for eight cycles at a 60 Hz fundamental. Calculate the remaining voltage, the depth of the sag and its duration:
Remaining per-unit magnitude: 408 V / 480 V = 0.85 p.u..
Sag depth: (480 − 408) V / 480 V × 100 = 15% below reference. The 0.85 p.u. magnitude and 15% reduction describe the same event in different terms.
Event duration: eight cycles ÷ 60 cycles/s = 0.1333 s = 133.3 milliseconds. The exercise assumes a steady 60 Hz rate during the interval.
The computed event satisfies the IEEE 1159-type short-duration sag definition; it does not alone establish a server outage, UPS transfer, breaker operation or utility-side cause. Interpretation requires the event timestamp, voltage measurement method, UPS topology, equipment logs and the effective tolerance of the affected loads. A sag could be recorded upstream but not reproduced at the UPS output.
What Harmonics Mean in an Electrical System
A harmonic is a sinusoidal voltage or current component at an integer multiple of the fundamental frequency. For a 60 Hz system, the third, fifth and seventh harmonics are 180 Hz, 300 Hz and 420 Hz. Non-linear equipment such as rectifiers and switch-mode power converters can draw a non-sinusoidal input current. The resulting harmonic currents flow through network impedance and may create voltage distortion at other points in the distribution system.
A measured current harmonic spectrum does not by itself say that the source voltage is distorted by the same percentage. Current distortion, source impedance, system resonance, harmonic phase angle and operating load all affect the voltage waveform. Three-phase distribution also requires attention to balance, neutral currents, equipment grounding and transformer suitability. The earlier OSEEC.015 electrical engineering lesson introduces general harmonic terminology; the present chapter focuses on data-center interpretation, UPS boundaries and operational evidence.
THD Is Not a Single Harmonic
Total harmonic distortion compares the combined RMS magnitude of all harmonic components above the fundamental with the RMS magnitude of the fundamental itself. For current, the fundamental-referenced expression is THDI = √(I2² + I3² + ⋯ + In²) / I1 × 100%, where all currents are RMS values in amperes. The analogous voltage formula uses voltage components. The quantities inside the square root are squared, so simply adding the harmonic percentages would be incorrect.
A THD percentage changes when the fundamental magnitude changes even if the harmonic currents stay constant. Total demand distortion (TDD) normalizes harmonic current against an applicable maximum demand current reference at the point of common coupling, as addressed by IEEE 519. A low instantaneous load can yield high current THD without producing a comparable current TDD. Neither quantity may be used as a universal pass/fail criterion without the relevant point of common coupling, applicable standard edition and system conditions.
Eaton, “How do you calculate total harmonic distortion or THD and total demand distortion or TDD?” (January 20, 2021), presented by Dan Carnovale through Eaton’s Power Systems Experience Center. An open manufacturer training lesson emphasizing the different denominators and use cases for THD and TDD.
Worked Example: Calculating Harmonic Current
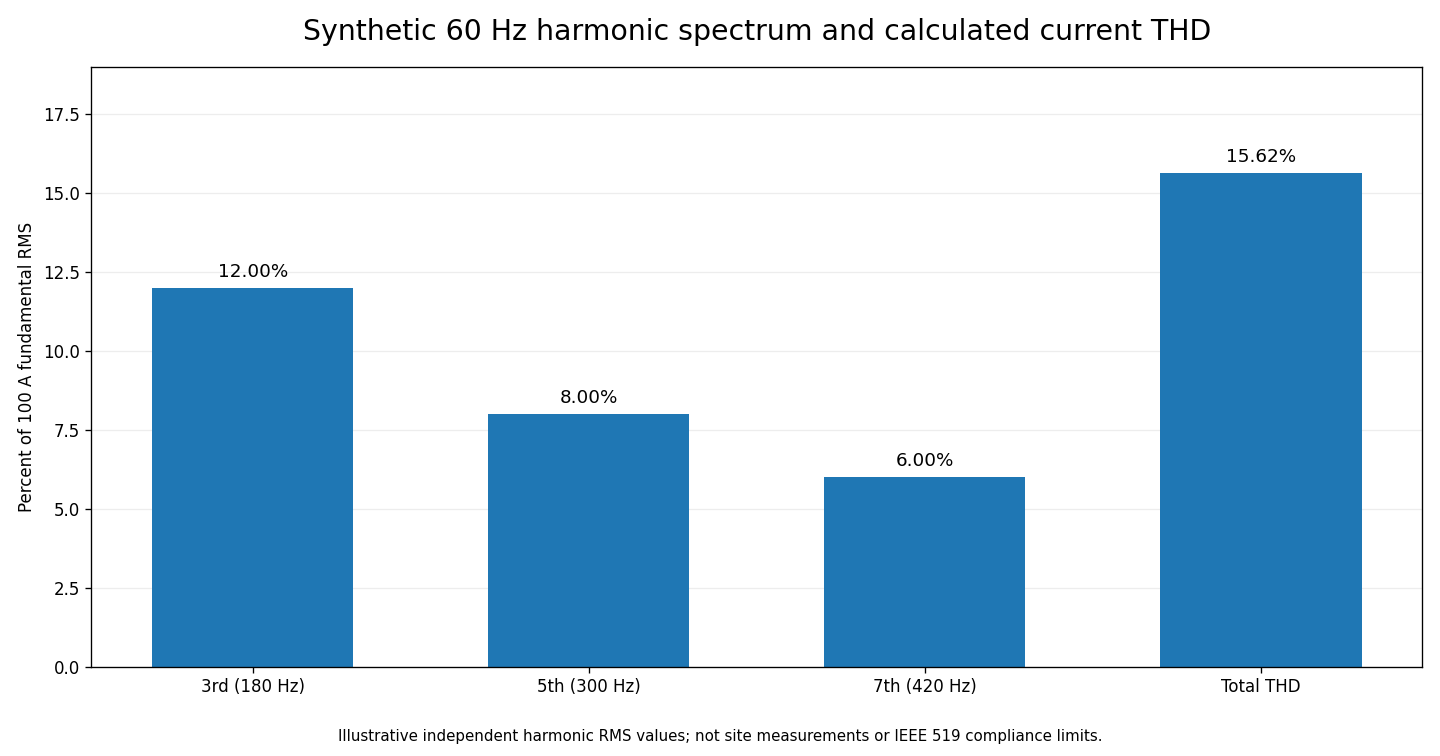
Suppose an invented instructional current spectrum contains a 100 A RMS fundamental at 60 Hz, a 12 A third harmonic, an 8 A fifth harmonic and a 6 A seventh harmonic. Assume other harmonic currents and interharmonics are zero for the exercise.
Combined harmonic RMS: √(12² + 8² + 6²) A = √244 A = 15.6205 A.
Current THD: 15.6205 A ÷ 100 A × 100 = 15.62%.
Total waveform RMS: √(100² + 12² + 8² + 6²) A = 101.21 A RMS, assuming the harmonics are orthogonal components of the periodic waveform. The total RMS is not the arithmetic sum 126 A.
A 15.62% synthetic THD result cannot be translated into an IEEE 519 compliance verdict: maximum-demand reference, point of common coupling, voltage level, harmonic order limits and the relevant test methodology remain unspecified. No actual meter produced the example.
Where to Instrument a Data Center
A data-center power-quality investigation should distinguish service entrance, main switchgear, generator output, UPS input, UPS output, PDU distribution and rack-level measurements. Two monitors can disagree without either being defective when they sit on opposite sides of conditioning equipment or use different sampling intervals and power-quality classifications. Capture instrument model, firmware revision, voltage wiring method, current-transformer ratio, clock synchronization, event configuration and channel definitions with the waveform/event record.
- Utility or service entrance: understand the delivered RMS voltage and major incoming disturbances before downstream equipment changes the signature.
- UPS input: determine what the rectifier or line-interactive front end actually received, with accompanying operating-mode records.
- UPS output: evaluate whether the critical-load supply stayed within manufacturer limits during the same time interval.
- Switchgear and PDU: localize disturbances and record load transitions, harmonic currents, phase imbalance, breaker status and protection indications.
- Rack and server management: correlate electrical events with server PSU alarms, BMC logs, hypervisor faults and IT-service impact. Ordinary rack PDU averages cannot necessarily resolve sub-cycle waveform details.
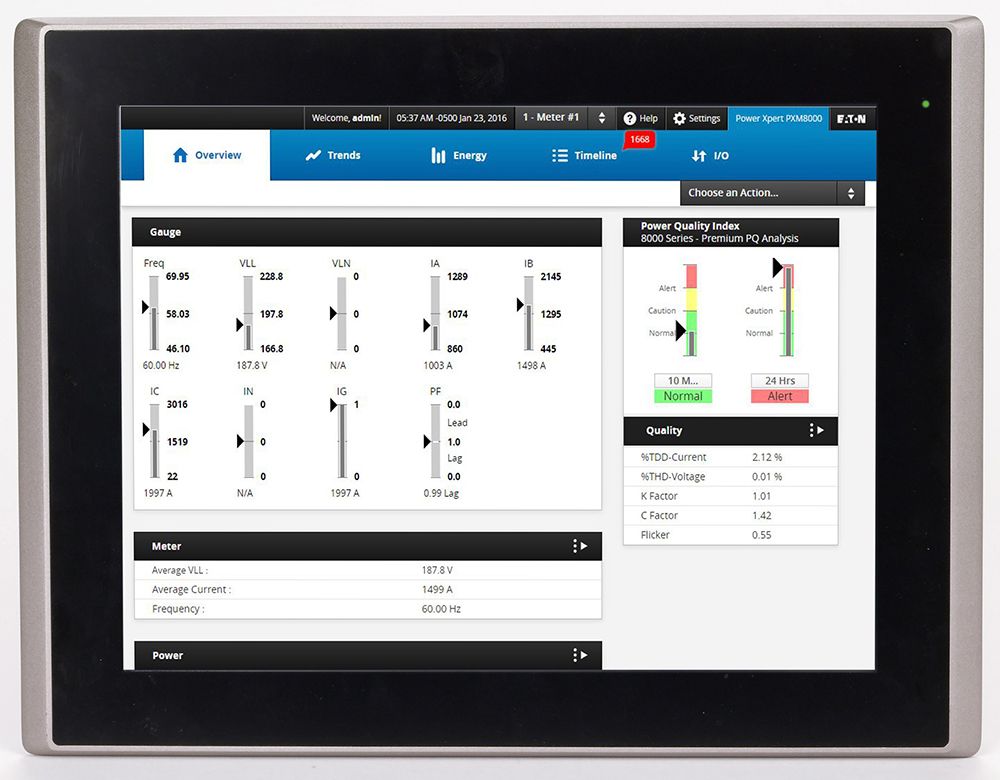
Eaton documents the Power Xpert 4000/6000/8000 meter family as supporting various power-quality monitoring functions including harmonics and event capture on appropriate models. Selection still requires the model’s exact sampling, storage, bandwidth, voltage rating and safe measurement interfaces; do not generalize the capabilities of one PXM model to all submeters. See Eaton’s power-meter overview.
UPS Coordination and Operating Modes
A UPS is a power-protection component, not a guarantee that all disturbances vanish. Double-conversion systems normally regenerate output AC from a DC link while in the intended protected mode, whereas other topologies and bypass states have different behavior. Some UPS equipment can transition to bypass during overload, fault or maintenance; such transitions change which upstream disturbance may reach the load. The actual input tolerance, output-voltage envelope, battery capacity, overload behavior and transfer performance are model-specific.
An engineering event review must time-correlate UPS mode, inverter status, battery discharge, static bypass commands, source voltage and output waveform. A voltage sag on a service bus does not necessarily imply the same sag reached the servers. Conversely, a healthy-looking UPS display may not contain the high-resolution transient record required to explain a downstream disturbance. Refer to OSDCEC.011 for the battery and redundancy context.
Harmonic mitigation can include suitably selected rectifier front ends, filters, transformer designs, distribution-impedance choices and load distribution. No filter or K-rated transformer should be treated as a universal fix: some devices tolerate additional heating without eliminating harmonic content, while filters may introduce resonance or other system interactions. Qualified engineers should conduct system studies before changing energized equipment or protection settings.
A Documentation-Only Engineering Lab
- Read an existing, authorized power-quality report or a manufacturer training example. Record the meter’s location, voltage reference, phase channel, RMS interval, event timestamp and instrument configuration.
- Use the hypothetical 480 V-to-408 V disturbance to recompute 0.85 p.u., 15% sag depth and 133.3 ms for eight cycles at 60 Hz. Indicate which values are assumptions.
- Recalculate current THD from 100 A fundamental and 12 A, 8 A and 6 A harmonics. Explain why 12 + 8 + 6 = 26% is the wrong THD.
- Identify what maximum-demand current and point-of-common-coupling information would be required before computing TDD and assessing standards-based harmonic limits.
- Create a comparison of desired evidence from service entrance, UPS input, UPS output and server management. State which hypotheses could be tested by each measurement.
- Write an escalation note for a hypothetical sag with no corresponding server reboot. Separate the measured electrical event, unaffected IT outcome and still-unknown system cause.
Troubleshooting and Failure-Analysis Checks
- Misleading low-resolution trends: a five-minute RMS average can hide a subsecond voltage sag; retrieve event-level data when available.
- Voltage versus current confusion: a current THD measurement does not directly specify voltage THD at another distribution point.
- THD versus TDD confusion: a high instantaneous current THD at low load is not an IEEE 519 TDD determination.
- UPS boundary mismatch: compare events on the same timestamp across input and output before assigning a fault to the UPS.
- Incorrect CT or VT settings: a ratio or channel wiring error may mis-scale RMS current, voltage and derived power quantities.
- Harmonic resonance or heating: investigate with qualified design analysis, actual current spectra and thermal data rather than installing a filter based on a single THD number.
- Clock misalignment: unsynchronized BMS, EPMS, UPS and server logs can produce a false event sequence.
- Unsafe live testing: avoid opening energized switchgear or attaching probes without an authorized qualified-person procedure, appropriate PPE, instrument ratings, and facility safety requirements.
Knowledge Check with Answers
- What does 0.85 p.u. represent? A measured RMS voltage equal to 85% of the specified reference for the same measurement convention.
- How deep is a change from 480 V to 408 V? Fifteen percent below the 480 V reference.
- How long are eight cycles at 60 Hz? 8/60 s, or approximately 133.3 ms.
- What frequency is the fifth harmonic on a 60 Hz system? 300 Hz.
- Does adding harmonic percentages directly give THD? No. The RMS harmonic components are combined by root-sum-square relative to the fundamental.
- What is current THD in the invented 100/12/8/6 A example? Approximately 15.62%.
- Is current THD the same as TDD? No. Their denominators differ, and TDD uses a defined maximum-demand reference.
- Does every UPS isolate every disturbance? No. Architecture, operating mode, bypass state and model-specific tolerances determine behavior.
- Can a five-minute trend prove there was no 100 ms sag? No. The trend may not preserve adequate time resolution.
- Should an engineer apply live probes as part of the classroom lab? No. The lab uses existing records or invented data, not energized measurement work.
Primary Educational Sources
The lesson draws from Schneider Electric, Power Quality eGuide for Data Centers (2025); IEEE Industry Applications Society-hosted conference presentation on data-center power quality (June 2025); Eaton’s openly accessible harmonic education library; and Eaton Power Xpert metering documentation. Consult the applicable current editions of IEEE 1159, IEEE 519 and individual UPS/meter manuals for standards-based projects. Public summaries in training presentations do not replace purchased or authorized standards text.
Conclusion
Good power quality engineering begins with correct event classification, consistent reference measurements and the actual electrical boundary. Harmonics, voltage sags and interruptions require different measurements and different remedies. UPS logs and high-resolution event records connect electrical observations to operational outcomes. Thorough reasoning preserves reliability without manufacturing a root cause from a single alarm or an isolated percentage.
Editor’s Note: OSDCEC.016 continues OSDCEC.015. The 480 V sag calculation and synthetic harmonic example were independently recalculated using Python; 15.62% is hypothetical current THD, not measured production data or an IEEE 519 pass/fail judgment. The 1200 × 630 featured cover is original AI-generated conceptual art, not site photography. The in-story Eaton photograph is an authentic manufacturer product image and the chart is original calculated educational media. Both featured educational videos were checked for title, publisher and source; rendered-player presence and interactive playback require separate checks. No actual data-center instruments, UPS systems, or energized switchgear were tested or operated.

For mobile scanning, display the QR code on another screen and scan it using a compatible Bitcoin wallet, or use the wallet’s saved-image scanner if supported. Check the receiving address and 5,000-sat amount before authorizing any transaction.
We volunteer daily to ensure the information on this platform is Verifiably True. If you would like to support the research, please scan the QR code.
BitcoinVersus.Tech is not a financial advisor. Financial reporting is provided solely for informational purposes. Electrical material is educational, not a substitute for a qualified engineer or site-specific electrical-safety procedures.


Leave a Reply