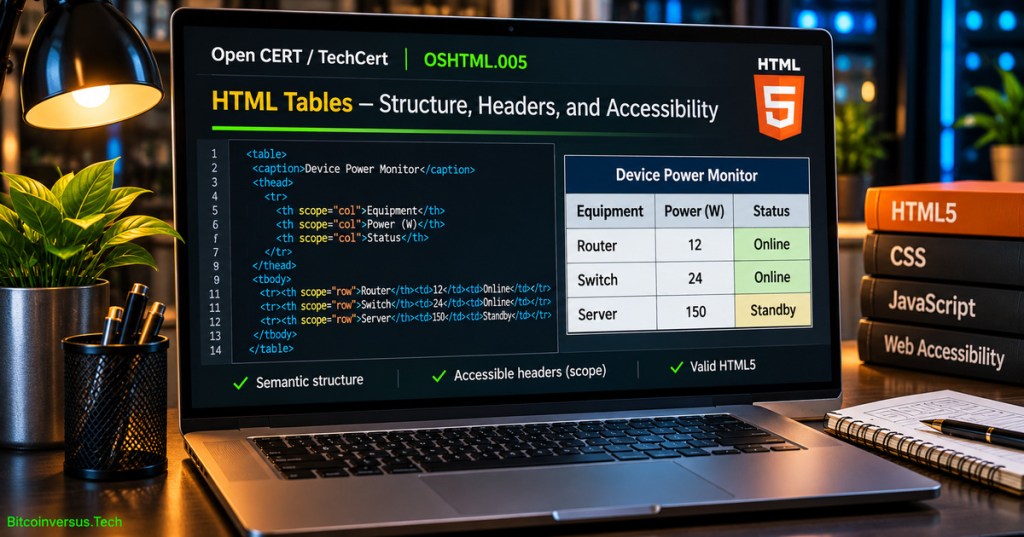
An HTML data table describes relationships between values arranged in rows and columns. The correct markup does more than draw a grid: it identifies header cells, names the data, and supplies row–column relationships that assistive technologies can interpret. OSHTML.005 teaches semantic table structure, accessible headers, grouped rows, responsive layout, and practical validation using a small equipment-power example.
The lesson advances the published OSHTML.004: Forms. Earlier lessons covered document structure, element nesting, and attributes. The goal is readable, standards-based markup—not a decorative grid or layout table.
Objectives and prerequisites
- Recognize when tabular information belongs in
<table>instead of a list, paragraph, or CSS layout container. - Build rows using
<tr>, data cells using<td>, and headers using<th>. - Label an entire table with
<caption>and group rows with<thead>,<tbody>, and<tfoot>. - Assign
scope="col"andscope="row"to distinguish column and row headers. - Explain when complex header relationships require
idandheadersor grouping attributes. - Create a readable mobile presentation without destroying table semantics.
- Run a complete HTML sample and 18 structural checks with Node.js.
Prerequisites: an editor, browser, and the HTML fundamentals in OSHTML.001–004. Node.js is needed only for the optional structural test harness. No external packages, credentials, paid services, or administrative privileges are required. The teaching example uses fabricated equipment values and is not a live site measurement.
When to use a table
A table is appropriate when values become meaningful through their intersection with row and column headings. A device-power report may describe a router, switch, and server, along with power and operational state. A list would be more appropriate for a few standalone troubleshooting instructions. Layout tables built to position a page header, sidebar, and footer are discouraged because their cell semantics can confuse assistive technologies and often perform poorly on narrow screens.
The MDN HTML table basics tutorial treats tables as a representation of tabular data, not page layout. The W3C Web Accessibility Initiative tables tutorial emphasizes programmatically determinable header–cell relationships.
Rows, header cells, and data cells
The outer <table> element contains the grid. Each <tr> defines a row. The cells in that row are <th> when they name a row or column, or <td> when they contain regular data. Using <th> only to make text bold is incorrect; use CSS when visual emphasis is required without a heading relationship.
<table>
  <tr>
    <th scope="col">Device</th>
    <th scope="col">Power (W)</th>
  </tr>
  <tr>
    <th scope="row">Router</th>
    <td>12</td>
  </tr>
</table>
scope="col" states that a header applies to cells in its column. scope="row" states that a header applies to cells in its row. For the router’s value, the useful context is both “Router” and “Power (W).” A screen reader can use semantic headers to provide the same context that a visual reader infers from a grid. Simple tables may be understandable without scope, but explicitly setting it makes the relationship clear.
Caption, thead, tbody, and tfoot
A <caption> is a visible title associated with its table; it must appear as the first child of <table>. A caption such as “Illustrative equipment power readings, watts (W)” explains the dataset and the unit. Use a page heading separately if the document needs a broader title.
<table>
  <caption>Example equipment power (W)</caption>
  <thead>
    <tr>
      <th scope="col">Equipment</th>
      <th scope="col">Power (W)</th>
    </tr>
  </thead>
  <tbody>
    <tr><th scope="row">Router</th><td>12</td></tr>
    <tr><th scope="row">Switch</th><td>24</td></tr>
  </tbody>
  <tfoot>
    <tr><th scope="row">Total</th><td>36</td></tr>
  </tfoot>
</table>
<thead> groups header rows, <tbody> contains the primary data, and <tfoot> contains supplementary rows such as a total. Browsers may insert an implicit <tbody> when a table is written without one. Explicit grouping makes author intent clearer and simplifies later CSS selection. The example total of 36 W comes only from 12 + 24 W in the two-row example.
Dave Gray, “How to Create Tables in HTML | HTML5 Table Tutorial”, January 11, 2022. Relevant chapters explain table headers, captions, rowspan/colspan, row groups, and scope. Source: the creator’s YouTube channel. The video reference was identified, but end-to-end playback on the published page remains unverified.
Complete illustrated equipment example
The following sample demonstrates three columns, labeled row headers, a table caption, and a summary footer. All values are made-up training inputs rather than actual measurements or manufacturer specifications. Watts  measure power; watt-hours (Wh) measure energy over an interval. An apparent 186 W total does not establish a real facility load or an energy-consumption reading.
| Equipment | Power | State |
|---|---|---|
| Router | 12 | Online |
| Switch | 24 | Online |
| Server | 150 | Standby |
| Total | 186 | Illustrative |
Illustrative HTML example. The values 12 W, 24 W and 150 W total 186 W. The scrollable wrapper protects narrow layouts while the header semantics remain intact. Editorial example data, not field observations.
The full offline source is available in DeviceTable.html. Its CSS uses border-collapse, spacing, and a scrollable wrapper. Display formatting is separate from the underlying HTML semantics. No network requests, JavaScript libraries, or outside stylesheets are needed.
Responsive tables without inaccessible layouts
A three-column table may fit a phone, while a larger schedule may not. Common approaches include fewer columns, shorter values, and a horizontally scrollable region. A wrapping region with max-width:100% and overflow-x:auto can preserve row–column associations rather than converting every cell into a disconnected visual card.
<div class="table-scroll"
     role="region"
     aria-label="Equipment power table"
     tabindex="0">
  <table>...</table>
</div>

<style>
.table-scroll {
  max-width: 100%;
  overflow-x: auto;
}
.table-scroll:focus-visible {
  outline: 2px solid #2563eb;
}
</style>
A focusable scroll region can assist keyboard access to wide content, but unnecessary tab stops should be avoided for tables that never overflow. Always test at narrow widths, higher zoom, keyboard navigation, and screen-reader navigation. The W3C responsive table tips recommend retaining structural relationships through alternate presentations. CSS styling belongs in a stylesheet in larger projects; the sample intentionally keeps a short self-contained lesson.
Spanning cells and complex headers
colspan lets a cell extend across multiple columns, while rowspan extends a cell down multiple rows. Both affect the implied grid. A row with one header spanning two columns does not contain an extra, independent third column unless another cell is provided. Incorrect spans can associate data with the wrong headers, making the table hard to interpret.
<table>
  <caption>Two-zone equipment sample</caption>
  <thead>
    <tr>
      <th scope="col">Zone</th>
      <th scope="col">Device</th>
      <th scope="col">Power (W)</th>
    </tr>
  </thead>
  <tbody>
    <tr>
      <th scope="rowgroup" rowspan="2">A</th>
      <th scope="row">Router</th><td>12</td>
    </tr>
    <tr><th scope="row">Switch</th><td>24</td></tr>
  </tbody>
</table>
The two-zone example shows rowspan="2" and a row-group header. Its grid structure should be tested with assistive technology; grouping boundaries and spans can be harder to interpret than ordinary one-header rows. More complex matrices may need explicit header identifiers such as <th id="power"> together with <td headers="device-a power"> so an assistive technology can identify the correct labels. Avoid complexity when multiple small tables would be clearer. See W3C’s table-header patterns and MDN table accessibility.
Dani Krossing, “27 | HOW TO CREATE & STYLE TABLES IN HTML | 2023”, February 19, 2023. The independent tutorial demonstrates HTML table construction and visual styling. Source: the creator’s YouTube channel. The video identity was checked; in-page playback has not been independently verified.
Runnable files and structural verification
Download DeviceTable.html and check-table.cjs into one directory. Open the HTML file directly in a desktop or mobile browser to inspect the example. From a terminal, run the following commands with a local Node.js installation:
node --check check-table.cjs
node --test check-table.cjs
The test harness uses only built-in Node.js modules and checks document type, language, viewport, descriptive heading, caption placement, table sections, column scopes, row scopes, expected body rows, numeric total, responsive wrapper, and a visible disclaimer for fabricated readings. On the lesson preparation system, 18 of 18 structural tests passed under Node.js v22.16.0. The source also parsed as one table with three data rows in an independent local HTML parser.
The tests are an educational structural checklist. They are not a full WHATWG conformance validator, do not exercise a real screen reader, and cannot guarantee mobile visual appearance or WCAG compliance. To extend QA, run the page through the Nu HTML Checker and perform manual keyboard, zoom, and assistive-technology checks.
Debugging and safe publication
- Header association missing: ensure column headers use
<th scope="col">and row labels use<th scope="row">. - No table title: include a meaningful
<caption>rather than substituting only a heading outside the table. - Wrong values under a heading: inspect
rowspan,colspan, row group boundaries, and actual cell counts. - Mobile overflow: remove avoidable columns, shorten labels, or wrap the grid in a tested scrolling region.
- Misleading measurements: include units, sample dates, source attribution, and calculated versus observed labels whenever real telemetry is published.
- Injection and unsafe markup: escape untrusted text before placing it into an HTML table; never concatenate user-controlled data into HTML without context-appropriate encoding.
- Accessibility assumed from color: do not rely on green/red cell shading alone to communicate equipment status; provide status text.
A table’s structure describes relationships, not the accuracy of the underlying data. Real energy and operations reports must distinguish instantaneous power from accumulated energy, explain sampling periods, and use verified telemetry. In a production project, validate the source values separately from verifying their HTML presentation.
Exercises and knowledge check
- Build a two-row table with an appropriate caption and two scoped column headers.
- Convert one device name from
<td>to a row-scoped<th>. Explain which relationship changed. - Add a fourth illustrative device with power 40 W and update the example total from 186 W to 226 W.
- Create separate
<thead>,<tbody>, and<tfoot>sections, then inspect the browser’s document tree. - Try a narrow viewport, keyboard navigation, and 200% zoom. Record any horizontal scrolling and whether each heading remains understandable.
- Describe the difference between
rowspanandcolspan, and one case whereheadersmay help. - Run the 18 tests, then intentionally remove one
scopeattribute in a throwaway copy. Explain the failing assertion.
Answer key: a caption names the dataset; a row-scoped th identifies related cells across the row; 186 + 40 = 226 W for the expanded fictional example; header/body/footer grouping clarifies section roles; rowspan covers rows whereas colspan covers columns; explicit headers associations can clarify complex tables; and removing a required scope violates the sample’s tested structural contract. A passing script does not replace manual accessibility review.
References and next steps
Authoritative sources: MDN — HTML Table Basics; MDN — Table Accessibility; W3C WAI — Tables Tutorial; W3C — Scope and Header Associations; W3C — Responsive Table Tips; and the two attributed public educational videos above. Continue into OSCSS.001: CSS Selectors for broader presentation rules or OSJavaScript.005 for programming behavior.
A well-built HTML table makes the data understandable both visually and programmatically. Captions define the subject, header scopes describe relationships, row groups organize the dataset, and responsive presentation preserves usability at different display sizes. Test both the source structure and the experience of someone navigating without a mouse.
Editor’s Note: OSHTML.005 follows the verified OSHTML.004 in the Open CERT / TechCert curriculum. The 1200 × 630 featured cover is original AI-generated educational artwork, not a captured browser screenshot. It carries the small neon-green “Bitcoinversus.Tech” signature at the bottom-left. The table’s 12 W, 24 W, and 150 W values are fabricated instruction data, not equipment measurements. The standalone HTML file and 18 Node.js checks were run locally. Both cited videos were identified from their public YouTube entries; actual end-to-end playback and mobile pixel-level inspection remain unverified.

To scan on mobile, open the QR on a second screen or use a wallet’s saved-image scanning feature. Confirm the receiving address and requested amount yourself before sending funds.
We volunteer daily to ensure the information on this platform is Verifiably True. If you would like to support the research, please scan the QR code.
Educational exercises do not replace independently verified technical or operational procedures.


Leave a Reply