
A pitcher can surrender a home run, or surrender first base. By 2004, opponents facing Barry Bonds increasingly chose the latter. The San Francisco Giants outfielder received 232 walks, including 120 intentional walks, both Major League Baseball single-season records. His career was also defined by record power, rare speed and exceptional contact discipline. As a statistical companion to our earlier Bonds opinion, seven sourced charts examine how his performance changed from his running years to his most feared batting seasons.
MLB’s official archival video shows Arizona intentionally walking Bonds with the bases loaded on May 28, 1998. Historical context, not footage from the 2004 walk-record season.
Chart 1. Total walks: 232 in 2004
The 2004 peak was not a minor improvement. Bonds drew 117 walks in 2000, 177 in 2001, 198 in 2002, 148 in 2003 and 232 in 2004. The final total equaled 37.6% of his 617 plate appearances, although some non-walk appearances also ended without an official at-bat. The series shows a nonlinear response to a hitter pitchers believed could punish a mistake.
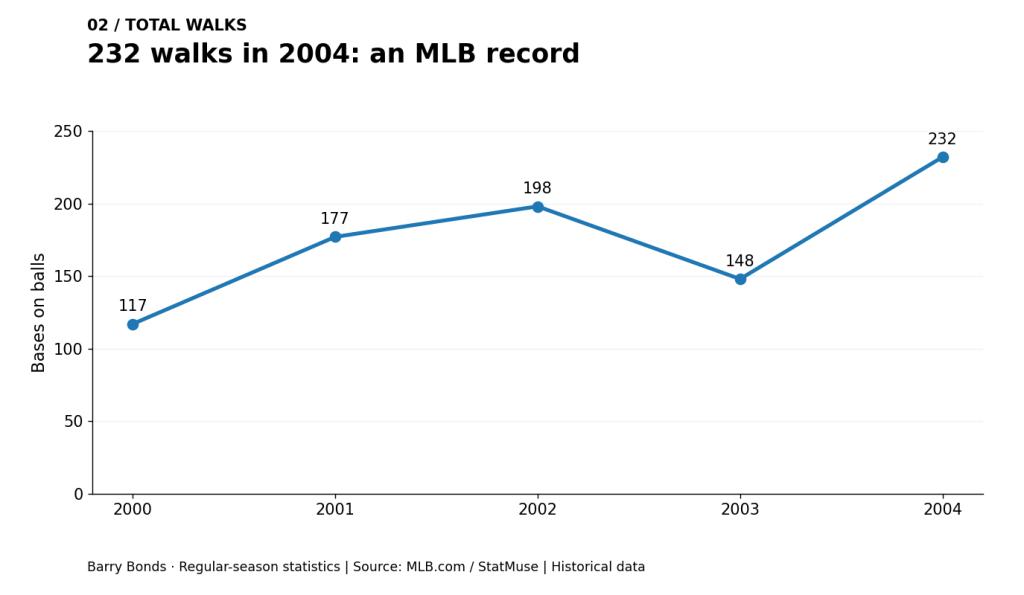
Chart 2. Intentional walks: 120 in 2004
Bonds’ intentional walks rose from 22 in 2000 to 35 in 2001, 68 in 2002, 61 in 2003 and 120 in 2004. Those 120 were already included in his 232 total walks, representing 51.7% of them. The remaining 112 were unintentional. Managers had reason to hesitate, especially with runners on base, but intentionally conceding first base still carried a scoring cost.
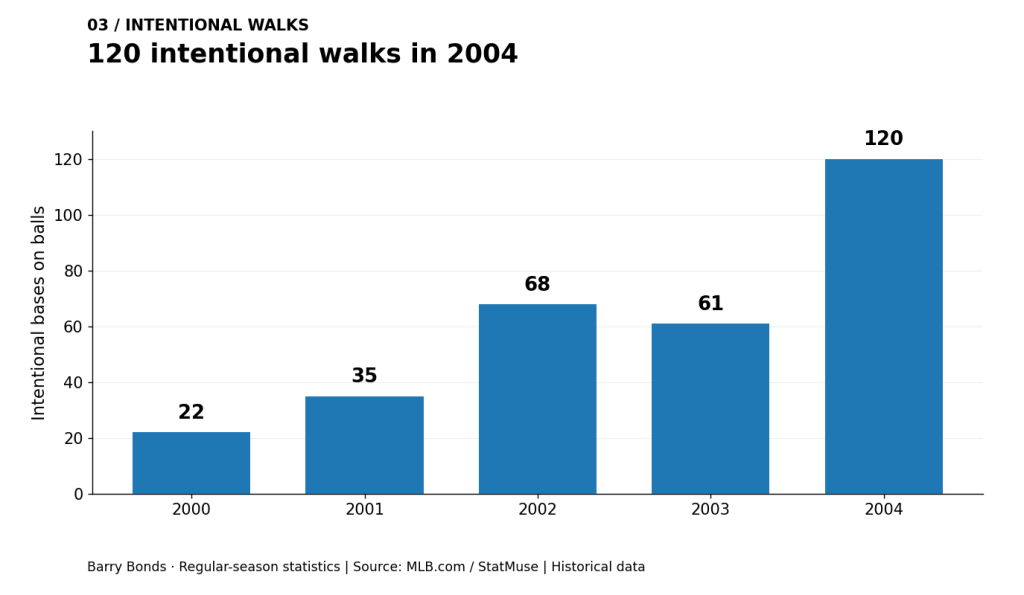
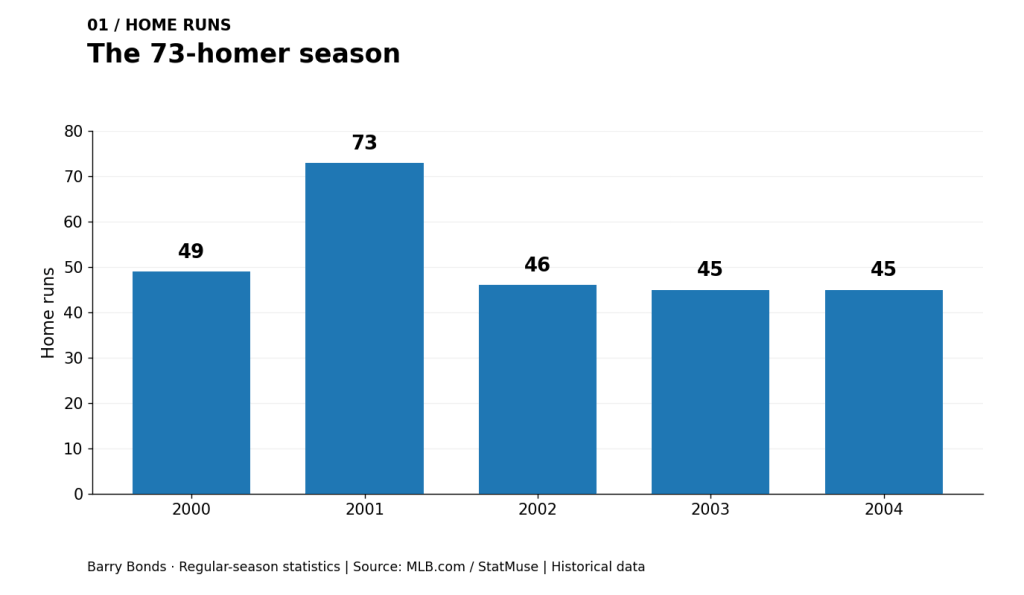
Chart 3. Home runs: the 73-homer record
His single-season home-run record came in 2001, with 73, following 49 in 2000. He hit 46 in 2002 and 45 in each of the next two seasons. The home-run peak preceded his record walk season by three years. The declining number of pitches to hit helps explain why raw home-run totals alone cannot represent his late-career batting threat.
Official MLB archive of Bonds hitting his 73rd home run against the Dodgers on October 7, 2001.
Chart 4. On-base percentage: .609 in 2004
Bonds reached base at a .609 rate in 2004, the highest qualifying single-season on-base percentage in MLB history. On-base percentage measures how often a hitter reaches through a hit, walk or hit-by-pitch, using the standard denominator that includes sacrifice flies. He paired the record with a .362 batting average. The walk surge helped produce an on-base result even elite pure hitters rarely approach.
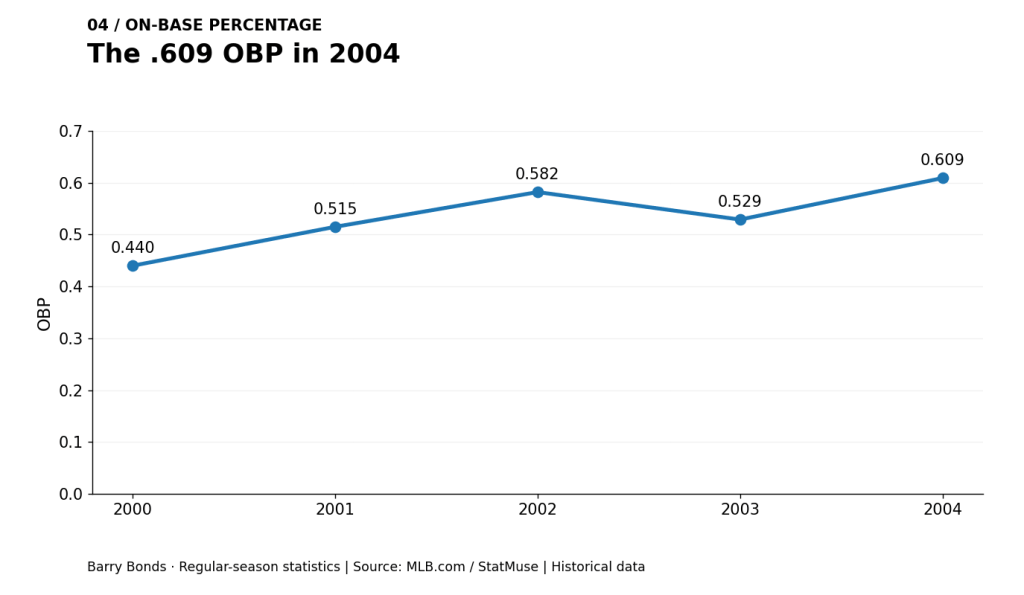
Chart 5. Slugging percentage: .863 in 2001
Slugging percentage captures total bases per official at-bat, not the frequency of reaching base. Bonds’ .863 in 2001 remains the MLB single-season record, followed by .799 in 2002, .749 in 2003 and .812 in 2004. The 2001 total of 411 bases in 476 at-bats produces approximately .863. The chart separates power production from the on-base skill measured above.
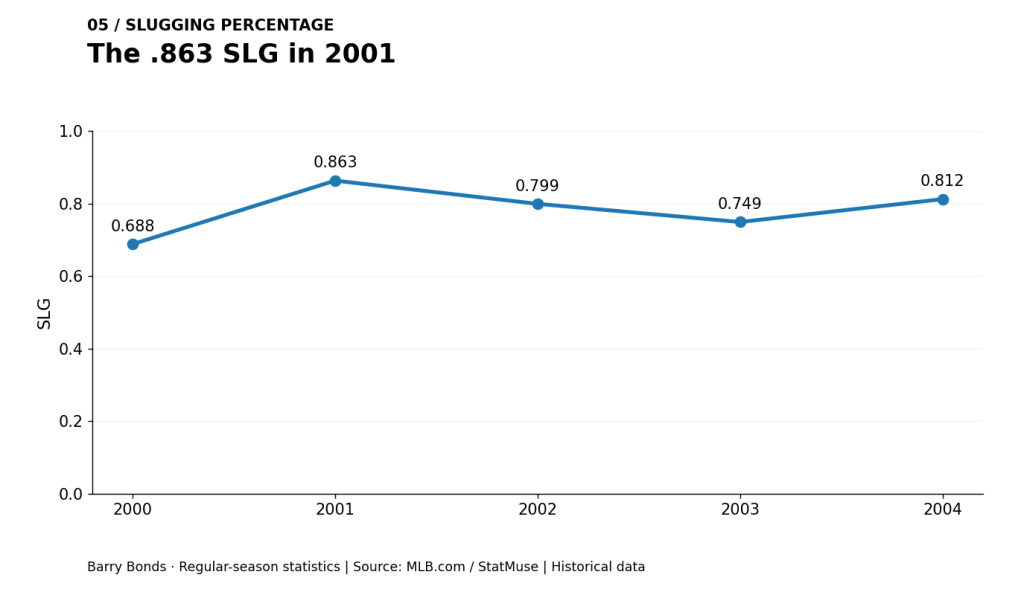
Chart 6. Stolen bases: the other half of 500–500
Before the late-career power explosion, Bonds also changed games on the bases. He stole 52 bases in 1990 and combined 42 home runs with 40 steals in 1996. Later he stole just six in 2004. His eventual 514 career stolen bases, combined with 762 homers, make him the lone member of the 500-home-run, 500-steal club. Our coverage of modern power-speed milestones offers another perspective.
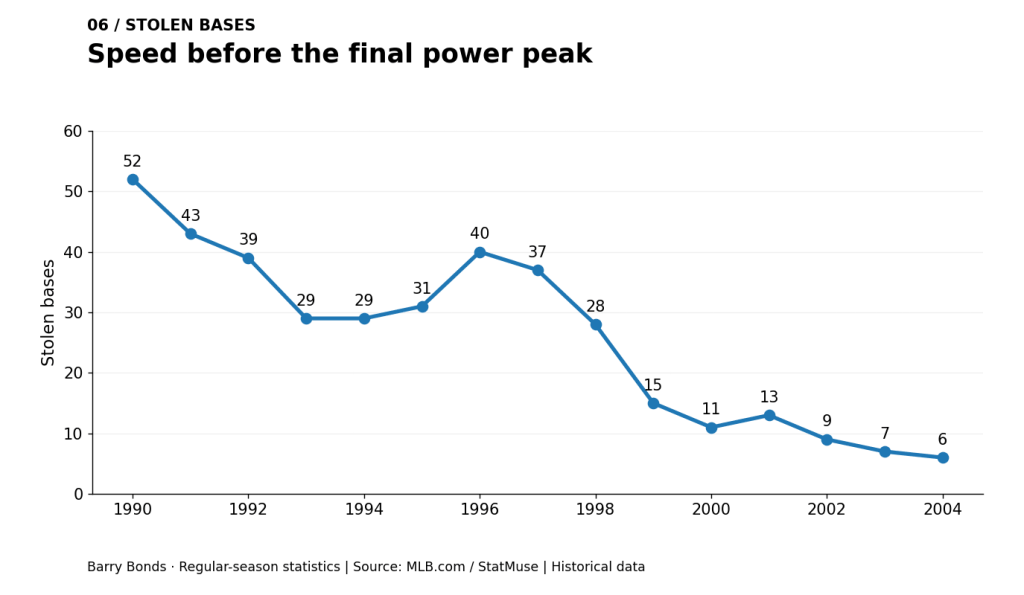
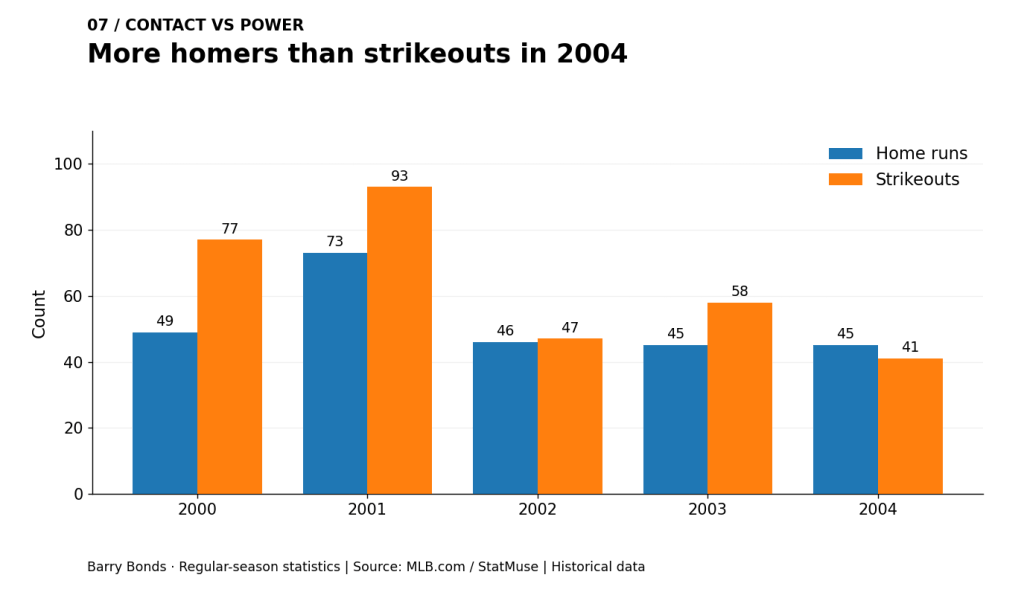
Chart 7. More homers than strikeouts in 2004
Bonds struck out 93 times while hitting 73 home runs in 2001. By 2004 he struck out only 41 times while hitting 45 homers, a rare reversal for a power hitter. He was not guaranteed a desirable pitch, and fewer at-bats also affected counting statistics. Our Statcast engineering coverage illustrates how today’s baseball analytics can examine fielding and hitting in additional dimensions.
The record and the debate
The numbers do not settle every historical argument. Bonds’ career is inseparable from the performance-enhancing-drug controversy, and comparisons across eras require consideration of rules, opponents and ballparks. Our earlier examination of Bonds and public judgment explored the disagreement. The charts establish the recorded production, not an uncontested verdict about greatness. They also reinforce a basic strike-zone lesson: a pitcher’s decision to challenge a hitter can shape the entire statistical record.
Data sources and method
Historical regular-season values come from MLB’s official Bonds season table, the Giants’ franchise biography and StatMuse’s 2000–2004 season-by-season table. Walk percentages are calculated from the verified 2004 totals. All seven original charts use zero-based vertical scales, recorded seasons and labeled units; no forecasts or synthetic data points are shown.
Editor’s Note: We volunteer daily to ensure the credibility of the information on this platform is Verifiably True. If you would like to support our work and help further secure the integrity of our research initiatives, please scan the QR code below to donate 5,000 sats.

Disclaimer: BitcoinVersus.tech presents independent sports data analysis and historical commentary. Historical statistics do not erase disputes concerning performance-enhancing drugs or settle subjective greatest-player rankings. The featured image is original cinematic anime artwork, not a historical photograph of Bonds.


Leave a Reply