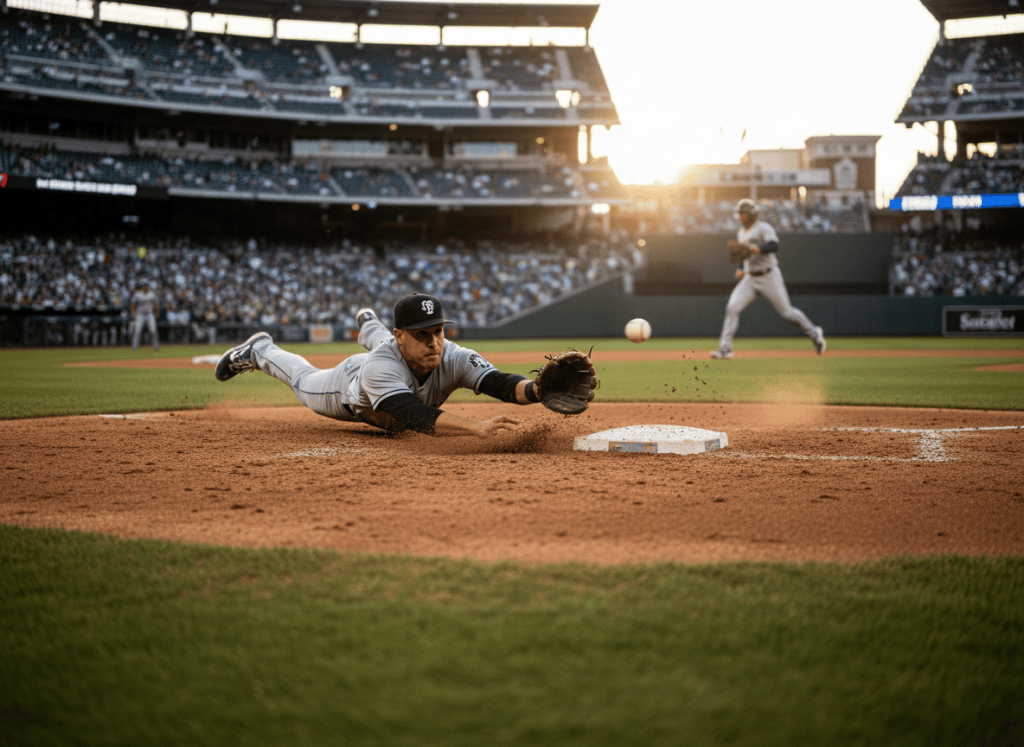
Baseball’s tracking technology can now put a number on one of the least appreciated defensive skills in the sport: a first baseman saving an infielder from a difficult throw.
MLB Statcast’s new First Base Receiving and Scoops data measures how often first basemen turn throws into outs after accounting for how difficult each opportunity is. The result is Receiving Outs Above Average, or Receiving OAA.
Alec Burleson leads the 2026 measurement
As the regular season reaches its final weekend, Baseball Savant lists St. Louis first baseman Alec Burleson at +7 Receiving OAA, the best mark in MLB. Freddie Freeman and Nick Kurtz follow at +4.
Burleson’s current Statcast line shows 568 outs on 594 tracked receiving opportunities, with an average expected out rate of 94.5 percent. That means the metric is doing more than counting catches. It is estimating the difficulty of the throws he has been asked to handle.
How the sports science works
Statcast assigns an out probability to throws from second base, shortstop and third base using inputs that include throw location, whether the ball arrives in the air or after a bounce, the runner’s speed and the runner’s distance from first when the ball reaches the first baseman. Throws must enter an eight-foot perimeter around the bag to be included.
The system classifies throws as on target, high, low, wide, scoops or bounces. A scoop is a throw that bounces between five and 15 feet from first base, while a bounce is one that hits the ground at least 15 feet away.
That distinction matters because routine throws dominate the position. MLB’s analysis found roughly 82 percent of receiving opportunities are on target, while scoops account for only about 2 percent. The rare difficult opportunities are therefore where an elite receiver can separate himself.
The technology changes how first base defense is valued
Traditional fielding statistics could record the out but had difficulty assigning the first baseman credit for rescuing a poor throw. Statcast can now model the throw itself and estimate how much additional probability the first baseman converted into an out.
Receiving OAA is also incorporated into Fielding Run Value. That gives analysts another way to measure first-base defense beyond errors and fielding percentage, and it illustrates the larger direction of sports science: turning movements that were once judged almost entirely by eye into measurable events.
A 3D view of every throw
Baseball Savant’s leaderboard includes interactive 3D field visualizations. Individual plays can show the trajectory of a throw along with the first baseman’s and runner’s positions. The public tool therefore functions as both a leaderboard and a visual sports-science laboratory.
The underlying data reaches back to 2021, allowing current players to be compared across multiple seasons. For 2026, Burleson’s lead provides a timely example of a skill that baseball could always see but could not previously quantify this way.
Sources
- Baseball Savant: First Base Receiving Leaderboard
- MLB Statcast glossary: First Base Receiving / Scoops
- MLB: Breaking down first-base receiving data
Related BitcoinVersus.tech coverage: Memphis AI stadium screening · Rover AI cycling glasses · Dolphin Android NetPlay · Local AI smart glasses
BitcoinVersus.Tech Editor’s Note: We volunteer daily to help ensure the credibility of information on this platform is verifiably true. BitcoinVersus.tech is not a financial advisor. This article is independent reporting and educational content for informational purposes only.


Leave a Reply