Bitcoin Cash provides an interesting test for the Power Efficiency Index because BCH uses the same SHA-256 proof-of-work algorithm as Bitcoin.
That means Bitcoin Cash participates in essentially the same ASIC hardware ecosystem, allowing changes in the rate of compute and the rate of energy efficiency to be compared against changes in BCH’s physical price.
BitcoinVersus.tech’s Power Efficiency Index, or PEI, measures a proof-of-work network against its own previous physical state rather than comparing the raw hashrate of unrelated cryptocurrencies.
The starting reference used here is Bitcoin Cash’s 2022 physical price of approximately $88.58. From that point, BCH network hashrate increased from roughly 1.44 EH/s near the end of 2022 to approximately 2.70 EH/s in September 2026. At the same time, the SHA-256 ASIC efficiency frontier progressed from roughly 21.5 J/TH to approximately 9.5 J/TH.
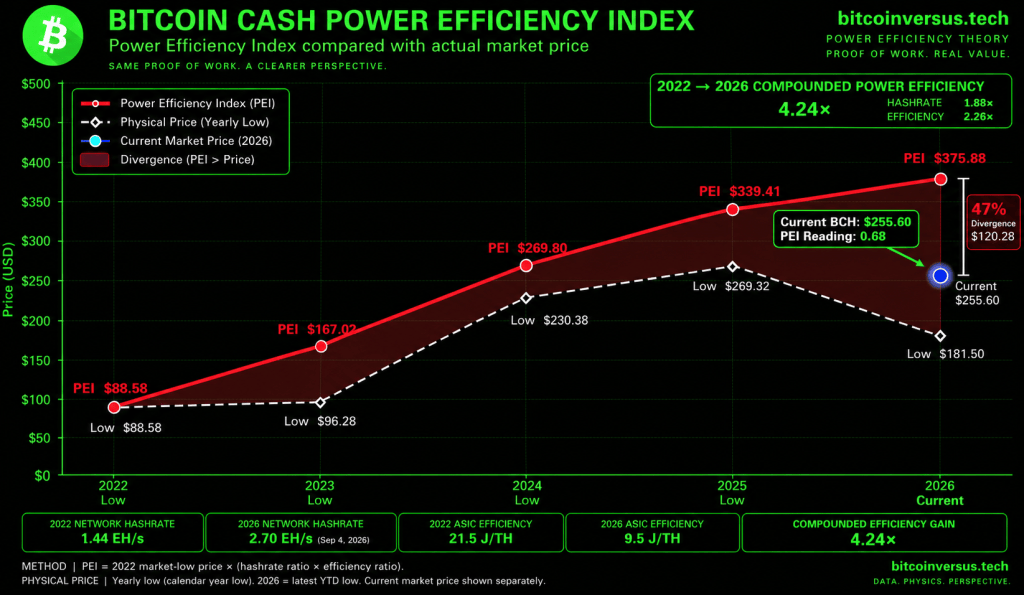
The rate of compute therefore increased approximately 1.88×, while the amount of energy required per terahash fell enough to represent roughly a 2.26× improvement in computational energy efficiency. Compounding those two measurements produces approximately 4.24× power-efficiency progression. Applied to BCH’s 2022 physical price, the model produces a 2026 PEI-implied price of approximately $376.
Bitcoin Cash currently trades around $255, producing a PEI reading of approximately 0.68. A PEI of 1.00 represents parity between market price and the model’s measured progression in compute and energy efficiency. A reading below 1.00 indicates that market price has not kept pace with the measured physical progression of the network and its available mining technology. At approximately 0.68, BCH is trading about 32% below PEI parity, while the calculated PEI price is roughly 47% above the current market price.
The divergence becomes even more visible when examining Bitcoin Cash’s annual physical price. BCH recorded yearly lows around $89 in 2022, $97 in 2023, $230 in 2024, $269 in 2025 and approximately $190 in 2026 so far. The important PEI question is not simply whether BCH’s price increased. It is whether price increased at approximately the same rate as the network’s compounded progression in compute and energy efficiency.
How to Read a BitcoinVersus.tech PEI Chart
Think of 1.00 PEI as the parity line. A reading near 1.00 means market price is approximately aligned with the power-efficiency progression measured by the model. A reading below 1.00 represents negative divergence: price is lagging the model.
A reading above 1.00 represents positive divergence: market price has advanced faster than the measured progression in compute and energy efficiency.
For Bitcoin Cash, the preliminary 2026 reading of approximately 0.68 PEI places BCH below parity. Under the BitcoinVersus.tech interpretation, that makes Bitcoin Cash undervalued relative to its measured power-efficiency progression.
It does not mean BCH must trade at $376. PEI is a measurement of the relationship between physical proof-of-work progression and market price—not a guarantee of future market behavior.
What makes BCH particularly useful for testing Power Efficiency Theory is its shared SHA-256 hardware environment with Bitcoin.
The network can gain access to more powerful and energy-efficient ASIC generations even when BCH’s market valuation does not move proportionally. That separation between what the machBitcoinVersus.Tech Editor’s Note:
We volunteer daily to ensure the credibility of the information on this platform is Verifiably True. If you would like to support to help further secure the integrity of our research initiatives, please donate here: 3C9o19EH5HSiwEPyCTmEKzxhNCbo2X6TTb
BitcoinVersus.tech is not a financial advisor. This media platform reports on financial subjects purely for informational purposes.
Disclaimer: The underlying inputs, calculations, and mathematical relationships used in the Power Efficiency Index are intended to be transparent and verifiable. The math is verifiable; the interpretation is experimental. PEI is a research framework, not a prediction of future price, guaranteed fair value, or financial advice. Actual market prices are influenced by many variables outside the model, including supply, demand, liquidity, regulation, adoption, speculation, and broader economic conditions.ines are capable of doing and what the market is willing to pay for the asset is precisely the divergence PEI is designed to measure.


Leave a Reply