
American wage inequality has widened over the past four decades even as many workers earned more after inflation, according to Economic Policy Institute research using government labor data. A 2026 analysis found real hourly pay at the 90th percentile grew 64.1% from 1979 to 2025, more than twice the 30.0% increase at the median and the 28.6% gain at the 10th percentile. The findings offer a more rigorous follow-up to the viral claim that Americans need $66 an hour to match 1970s homebuying power.
The Economic Policy Institute study draws on Current Population Survey microdata, adjusted for inflation. Its comparison measures changes in hourly wages at different points of the distribution, not a single household’s mortgage qualification. The earlier BitcoinVersus.Tech $66/hour fact-check found that the viral figure was an illustrative housing budget, not a government wage standard.
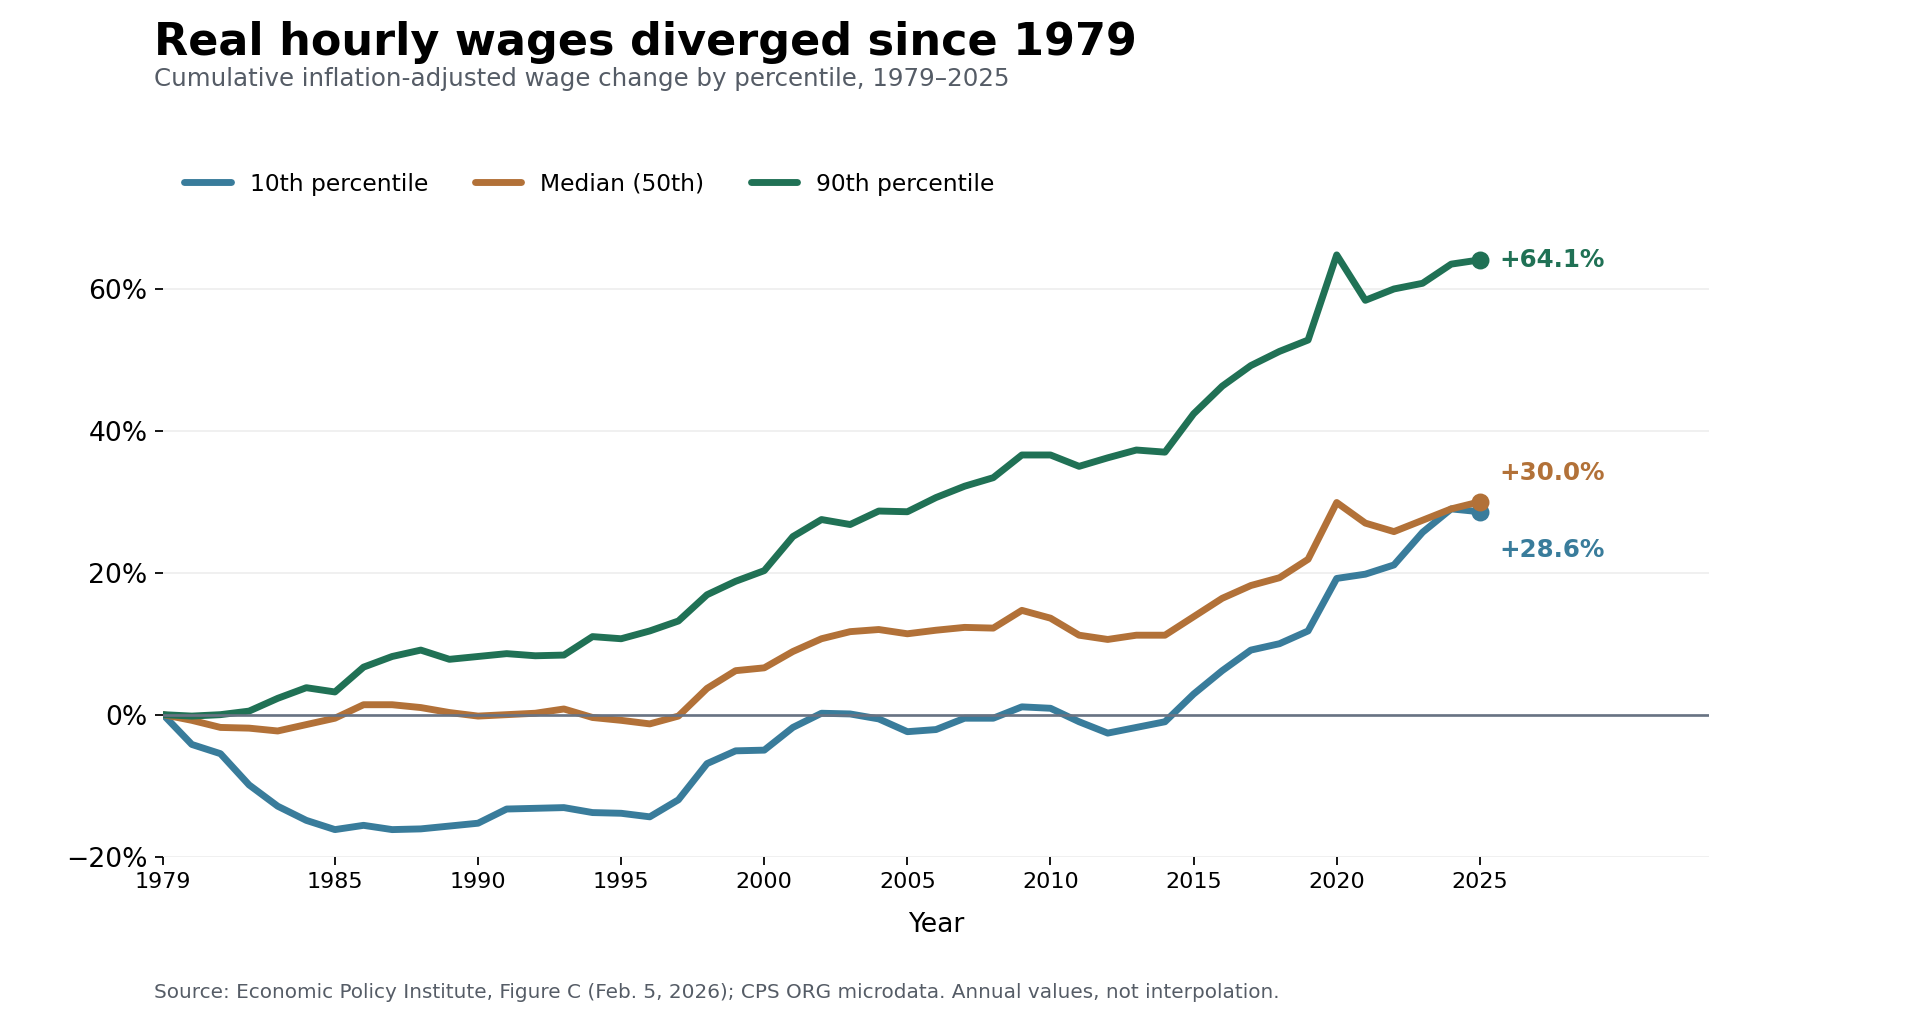
Wage gains are uneven
The EPI study also reported that lower-wage workers faced renewed affordability pressure in 2025 as their pay growth stalled. The cumulative gains since 1979 do not mean purchasing power increased evenly across necessities: rent, home prices, healthcare, transport and childcare can move differently from broad consumer inflation.
A separate EPI analysis of Social Security wage statistics found real annual wages for the top 1% grew 181.7% between 1979 and 2023, compared with 43.7% for the bottom 90%. Those are annual earnings figures from a different data source and period, so they should not be plotted as though they were the hourly-wage series above. The top 1% also received 12.4% of aggregate wages in 2023, compared with 7.3% in 1979.
The difference matters for understanding economic inequality. An hourly wage describes compensation for work; annual earnings can also reflect hours worked and bonuses. Neither measure directly captures wealth from stocks, businesses, home equity or inheritances.
Wealth is more concentrated than pay
The Federal Reserve’s Distributional Financial Accounts, updated September 18, 2026, show that the wealthiest 1% of U.S. households held 32.5% of net worth in the second quarter. The estimates combine household surveys with national balance-sheet accounts and are subject to revisions. Wealth percentiles are ranked by net worth, not wage income.

Assets can appreciate independently of a paycheck, helping explain why an increase in median wages does not automatically narrow the wealth gap. Conversely, households with high salaries may carry mortgages or other debts that reduce net worth. The Federal Reserve’s published series allows comparisons across time without treating income and wealth as interchangeable.
What the research says about housing
Housing is an important mechanism connecting the two distributions. Homeownership can build equity as borrowers repay principal and property values change, while renters generally do not receive those housing-asset gains. Interest rates, down payments, property taxes and local supply constraints also affect access. The wage study does not calculate a universal salary needed to purchase a typical home.
Earlier BitcoinVersus.Tech reporting examined homebuying income requirements, household essential spending and generational housing comparisons. Together, the studies support a narrower conclusion: workers at the top of the wage distribution have experienced much stronger long-run pay growth, while accumulated wealth remains highly concentrated. Neither result proves that every younger worker is worse off than every baby boomer.
We volunteer daily to ensure the information on this platform is Verifiably True. If you would like to support the research, please scan QR code.

Editor’s Note: Wage-growth percentages come from EPI’s analysis of government survey data for 1979–2025; the top 1% annual-wage comparison uses EPI’s separate 1979–2023 Social Security analysis. Wealth-share data come from the Federal Reserve for Q2 2026. The chart reproduces the cited wage-study values and is not an official EPI image.


Leave a Reply