
Josh Allen and Joe Burrow are the two leading quarterback candidates in one prominent 2026 NFL MVP prediction market. Seven games reveal: Burrow dominates passing touchdown efficiency, while Allen produces extraordinary rushing scores.
On November 8, Kalshi’s MVP market listed Allen first at 31% and Burrow second at 18%. Market prices represent changing trader expectations, not an official NFL ranking. The comparison below uses league Allen and Burrow game logs through November 7, with seven games played apiece.
Touchdown-to-interception ratio separates the passers
Burrow has thrown 20 touchdowns against six interceptions, producing a 3.33-to-1 passing TD/INT ratio. Allen has 11 touchdowns and five interceptions, or 2.20-to-1. Burrow’s ratio is 51.5% higher. Rushing scores are excluded from the passing-only ratio.
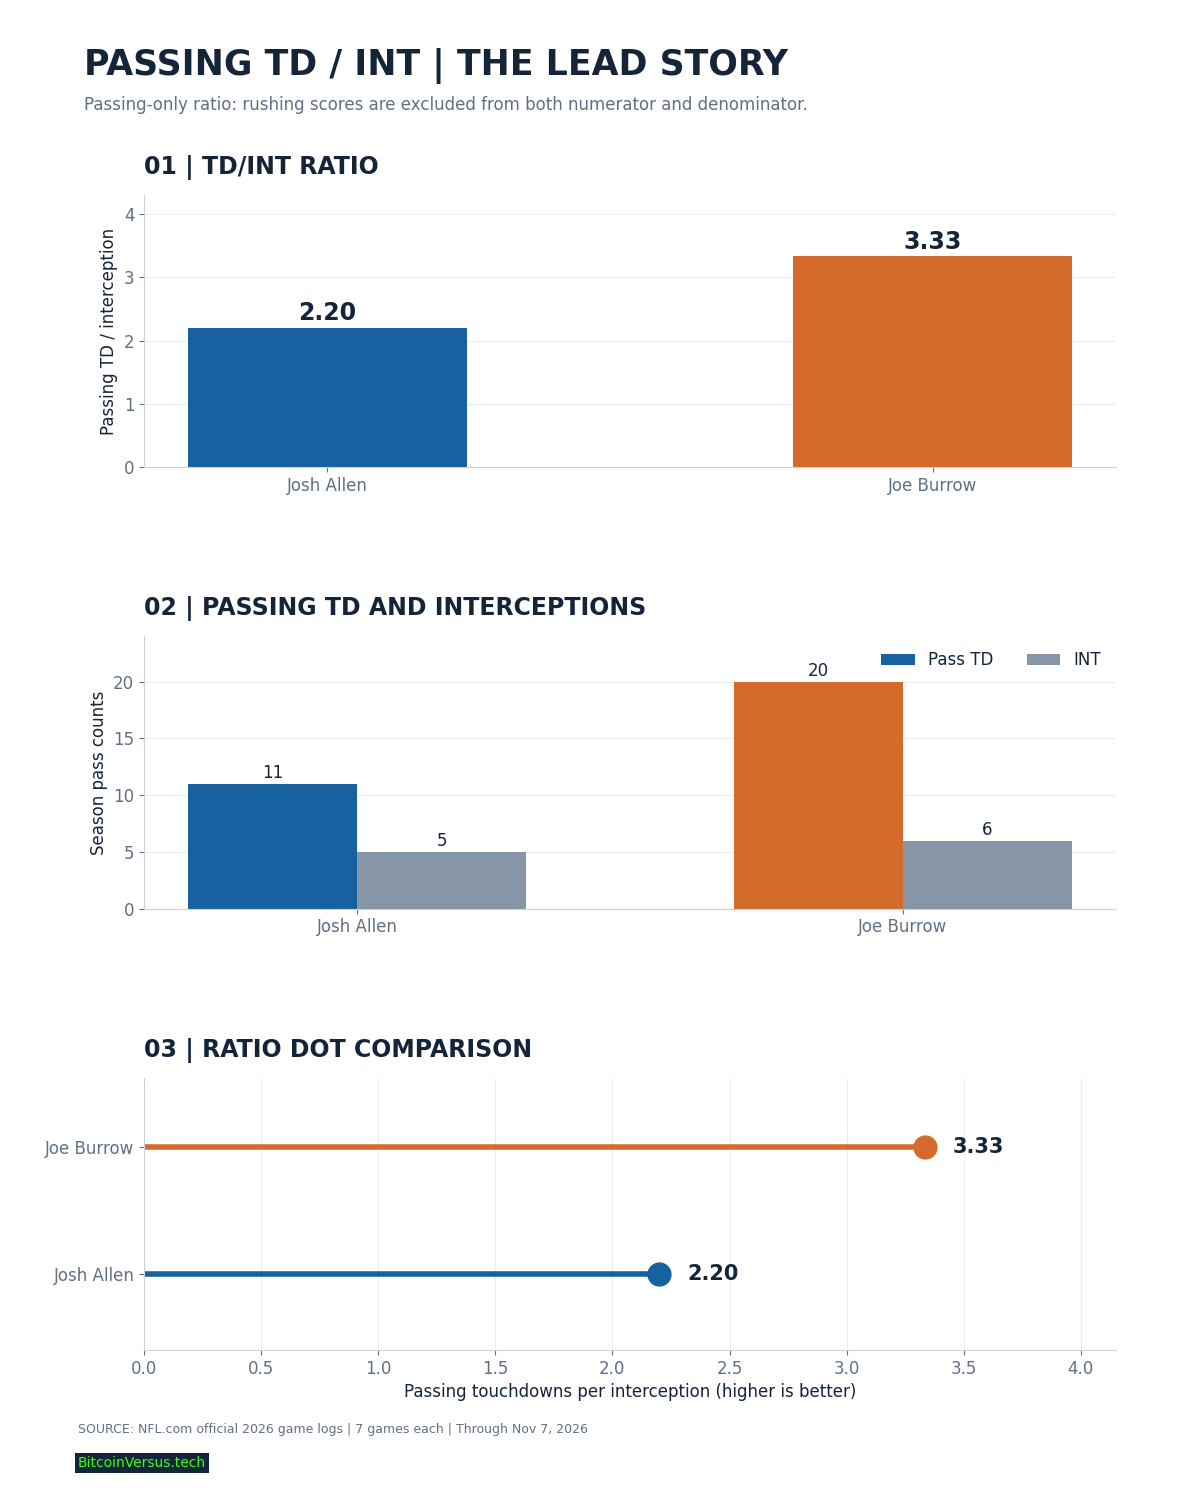
Burrow leads the NFL in passing touchdowns. Yet his three interceptions against Tennessee on November 1 reveal the danger of evaluating efficiency without considering volatility. Historical perspective appears in BitcoinVersus.Tech’s ranking of great TD-to-INT seasons.
Passing productivity favors Burrow
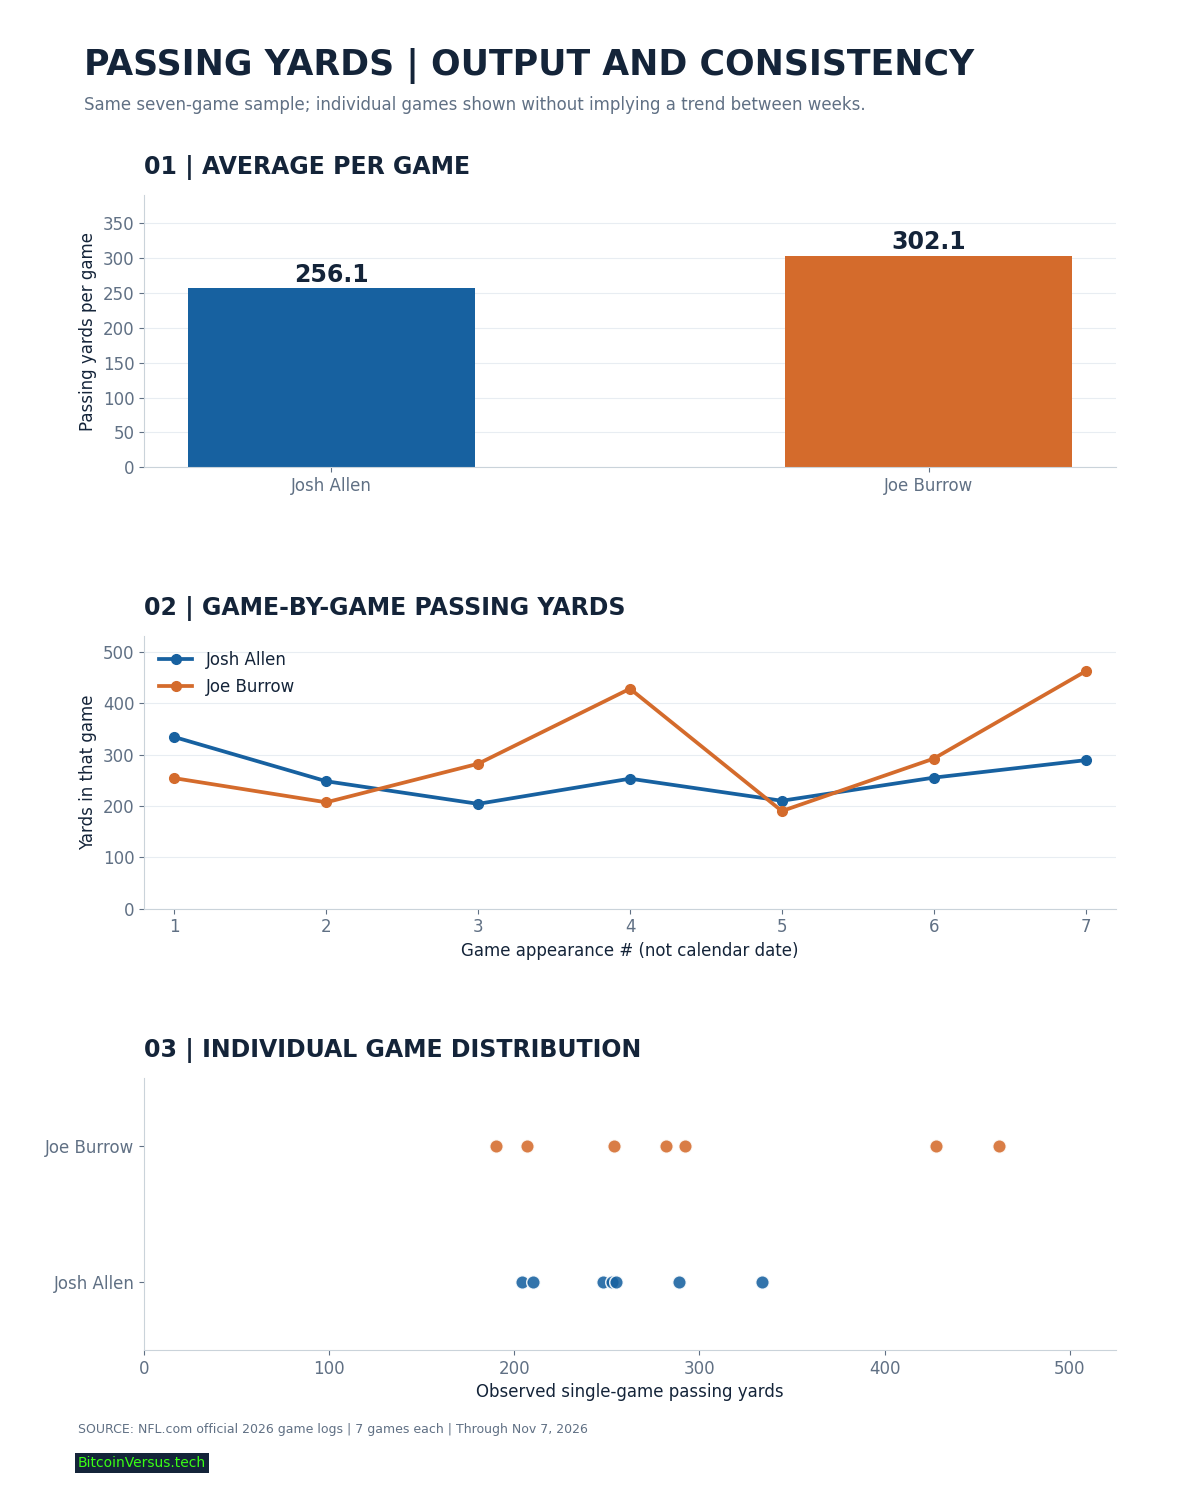
Burrow has 2,115 passing yards, or 302.1 per game, compared with Allen’s 1,793 and 256.1. Burrow attempts 38.1 passes per game against Allen’s 29.3, so greater volume contributes to the yardage gap. Allen generates more yards per attempt: approximately 8.75 versus Burrow’s 7.92.
Allen’s rushing scores change the verdict
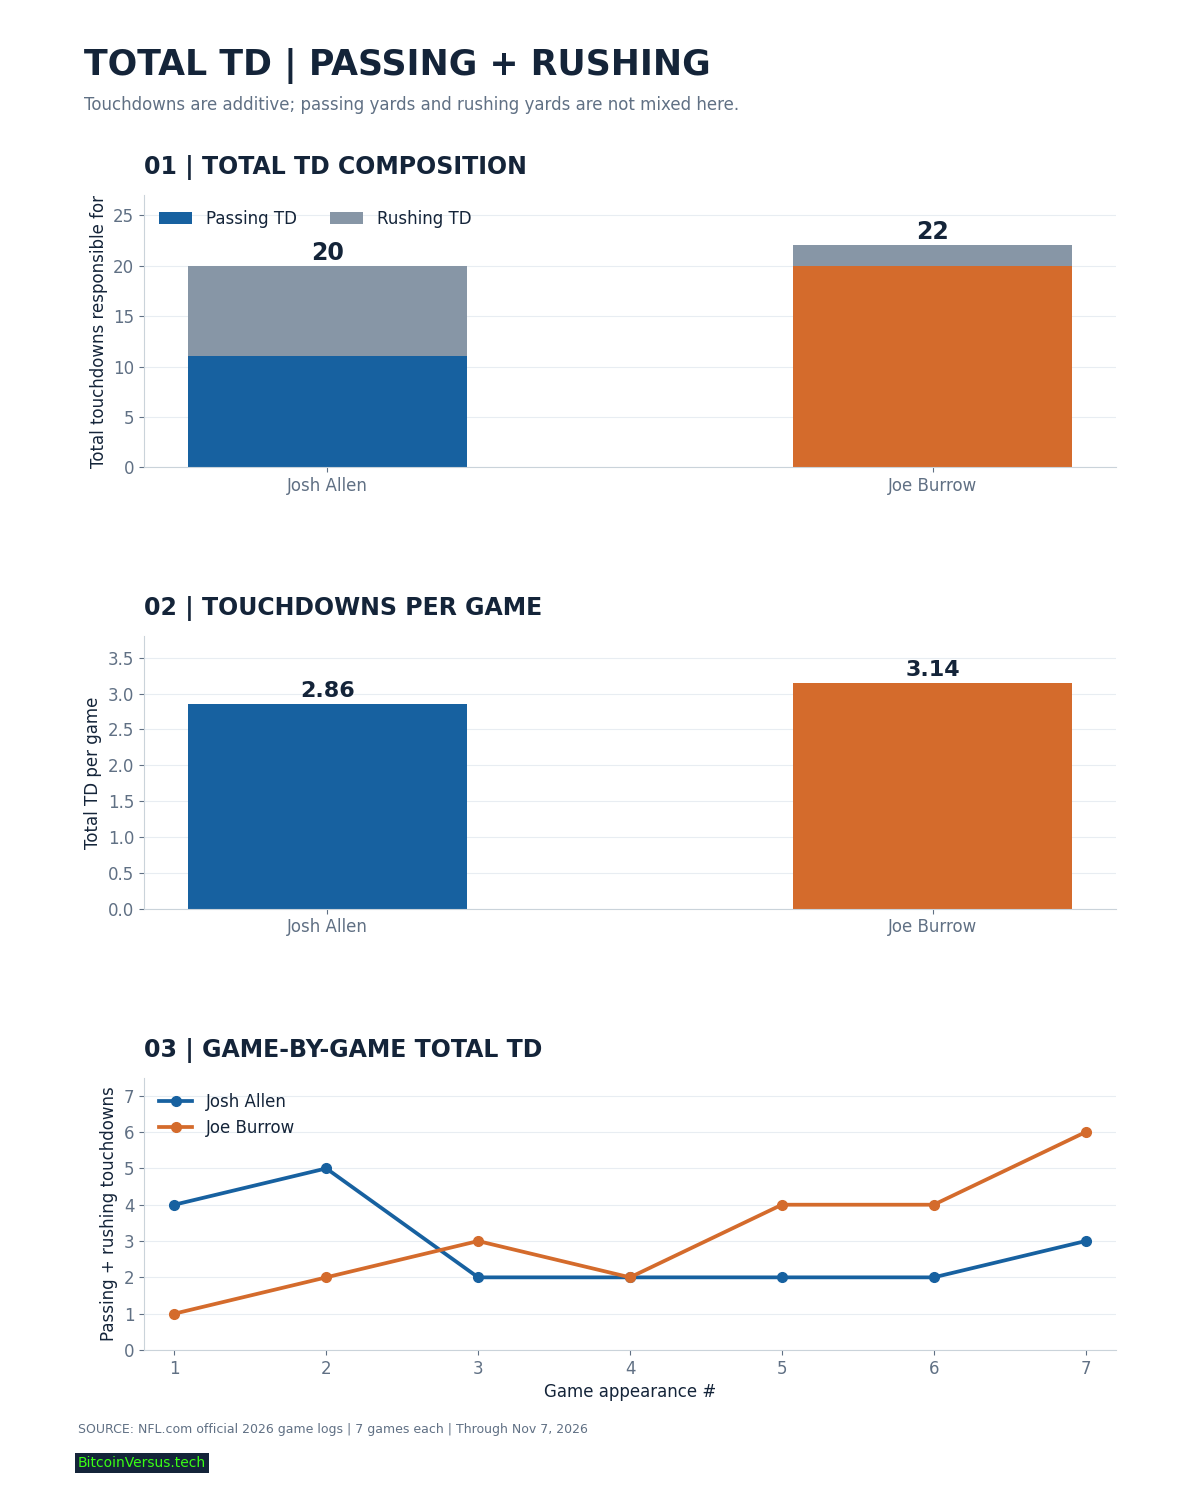
Allen has scored nine rushing touchdowns and run for 270 yards; Burrow has two rushing scores and 70 yards. Adding passing and rushing touchdowns gives Allen 20 and Burrow 22 total touchdowns responsible for, a far tighter contest than the passing totals suggest.
Accuracy and decision-making
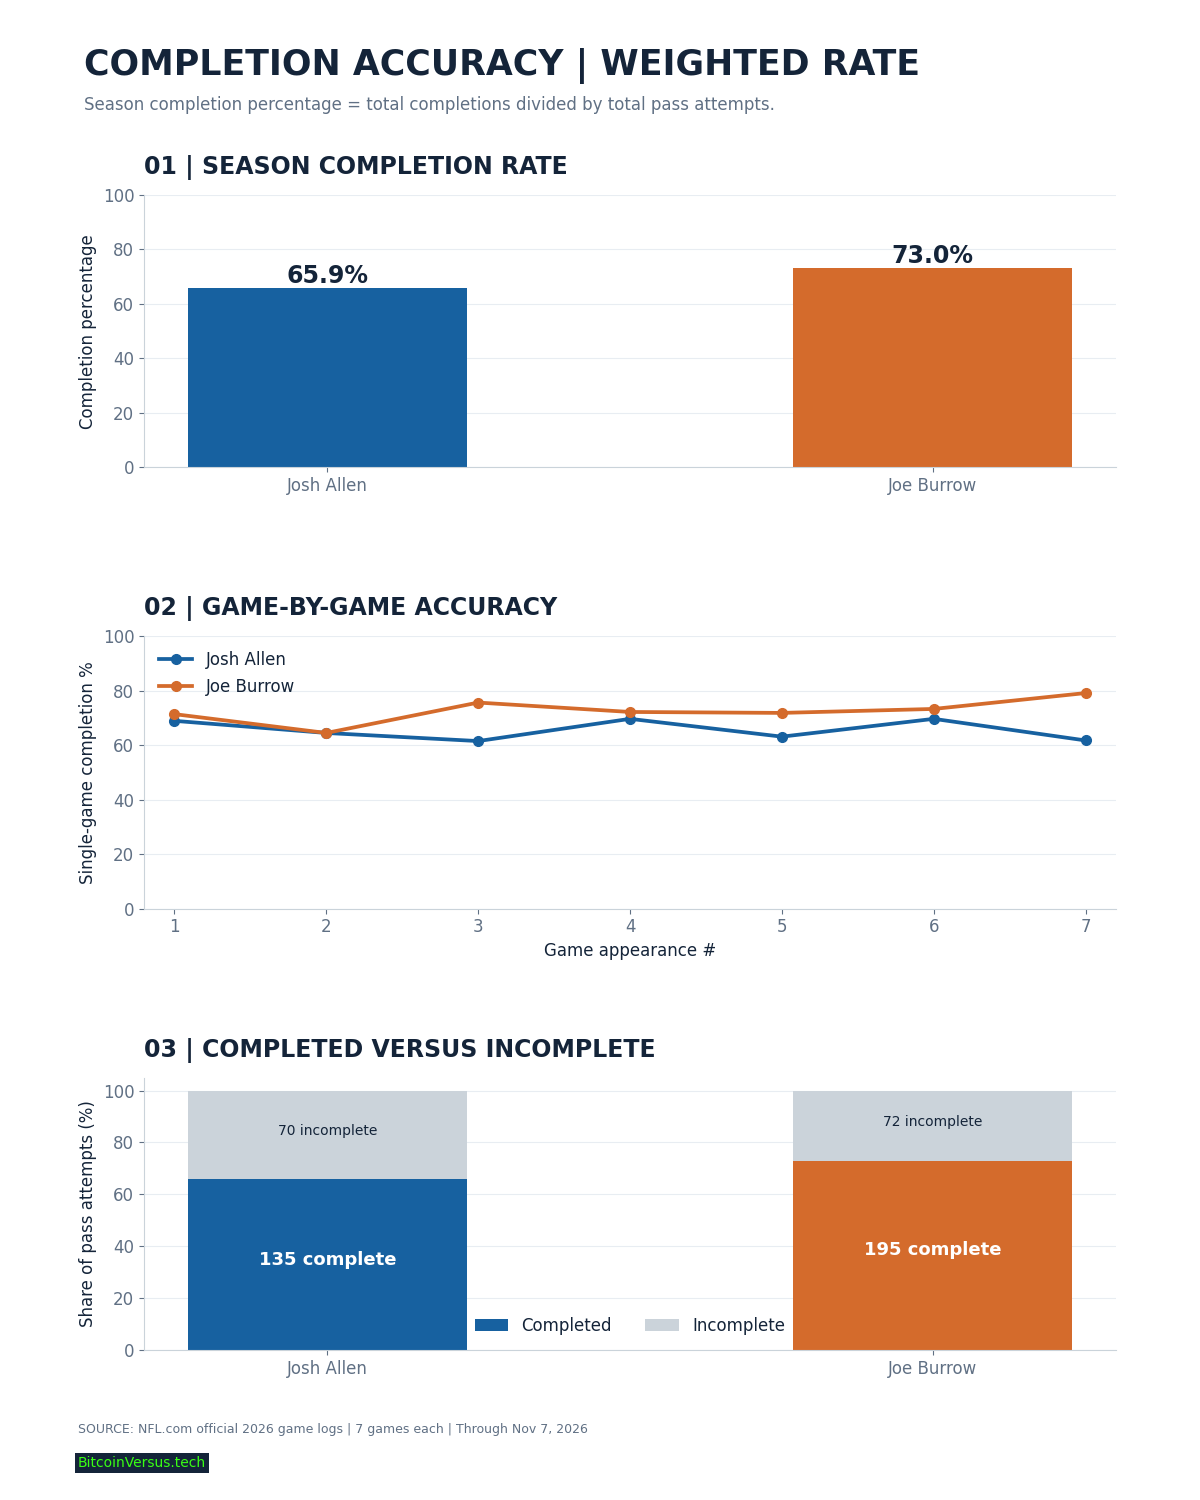
Burrow has completed 195 of 267 attempts (73.0%), while Allen has completed 135 of 205 (65.9%). Burrow also leads in passer rating, 111.6 to 101.1. Completion percentages depend on target depth, scheme, receiver separation and game context; precision alone cannot establish total quarterback value.
Professional scouting reports
Josh Allen — strengths: Explosive arm talent, improvisational pocket escapes and unmatched short-yardage rushing leverage. Defenses must account for his legs near the goal line, creating additional pressure on coverage assignments. Weaknesses: Five interceptions, a 65.9% completion rate and increased physical exposure from rushing volume. His two-interception performance against the Chargers highlights turnover volatility.
Joe Burrow — strengths: Fast coverage diagnosis, anticipatory timing, tight-window placement and sustained high-volume passing. His 462-yard, five-passing-TD performance against Tennessee showcased both production and late-game resilience. Weaknesses: Six interceptions, including three against Tennessee, and substantially less designed rushing danger than Allen. Turnover control remains crucial. For broader scouting context, see BitcoinVersus.Tech’s NFL draft-evaluator review.
Game film and analytical limitations
The Bills’ official video archive includes Allen’s recent plays against Baltimore, while Cincinnati’s official highlight package documents Burrow’s Week 8 Tennessee performance. NFL tracking is increasingly sophisticated, as covered in BitcoinVersus.Tech’s reports on real-time NFL data infrastructure and AI recognition of blocking schemes.
Following the SmartChart 40-type selection protocol, the report compares three suitable chart forms for each of four measurement groups. Chronological lines track individual game appearances; they do not imply that both quarterbacks played on identical calendar dates.
Early MVP verdict
Burrow wins the passing-efficiency comparison; Allen makes the stronger dual-threat argument. The former leads in passing TD/INT ratio, yards, completion accuracy and passer rating. The latter owns the rushing touchdown edge and higher yards per attempt. Team success, opponent strength, turnovers and the remaining schedule will determine whether either player converts an early statistical case into MVP honors.
Editor’s Note
Metrics reflect seven games per quarterback through November 7, 2026. TD/INT uses passing touchdowns divided by interceptions; rushing scores are reported separately. Percent differences use unrounded figures. Scouting judgments are editorial assessments; MVP market prices are not official award probabilities.
Support BitcoinVersus.Tech
For an optional 5,000-satoshi contribution, scan the approved QR below using a compatible Bitcoin wallet. Mobile readers can open the article on another screen or import the QR image where supported. Verify the destination and amount before payment.

We volunteer daily to ensure the information on this platform is Verifiably True. If you would like to support the research, please scan QR code.


Leave a Reply