
The phrase “worst NBA players” demands a definition. For November 2026, a seven-player countdown can be built from the lowest ESPN Net Pts/100 impact estimates circulated in a mid-November basketball discussion. Each named player occupied an NBA roster, but the figures measure a narrow early-season performance estimate, not innate talent, career value or a league-issued verdict.
The live ESPN index could not be independently audited for the same snapshot. The estimates below are therefore attributed to the community reproduction, while minutes and shooting context were cross-checked against 2026–27 season statistics. All seven rankings are provisional. For a separate look at how early results can mislead, see our rookie draft-value study.
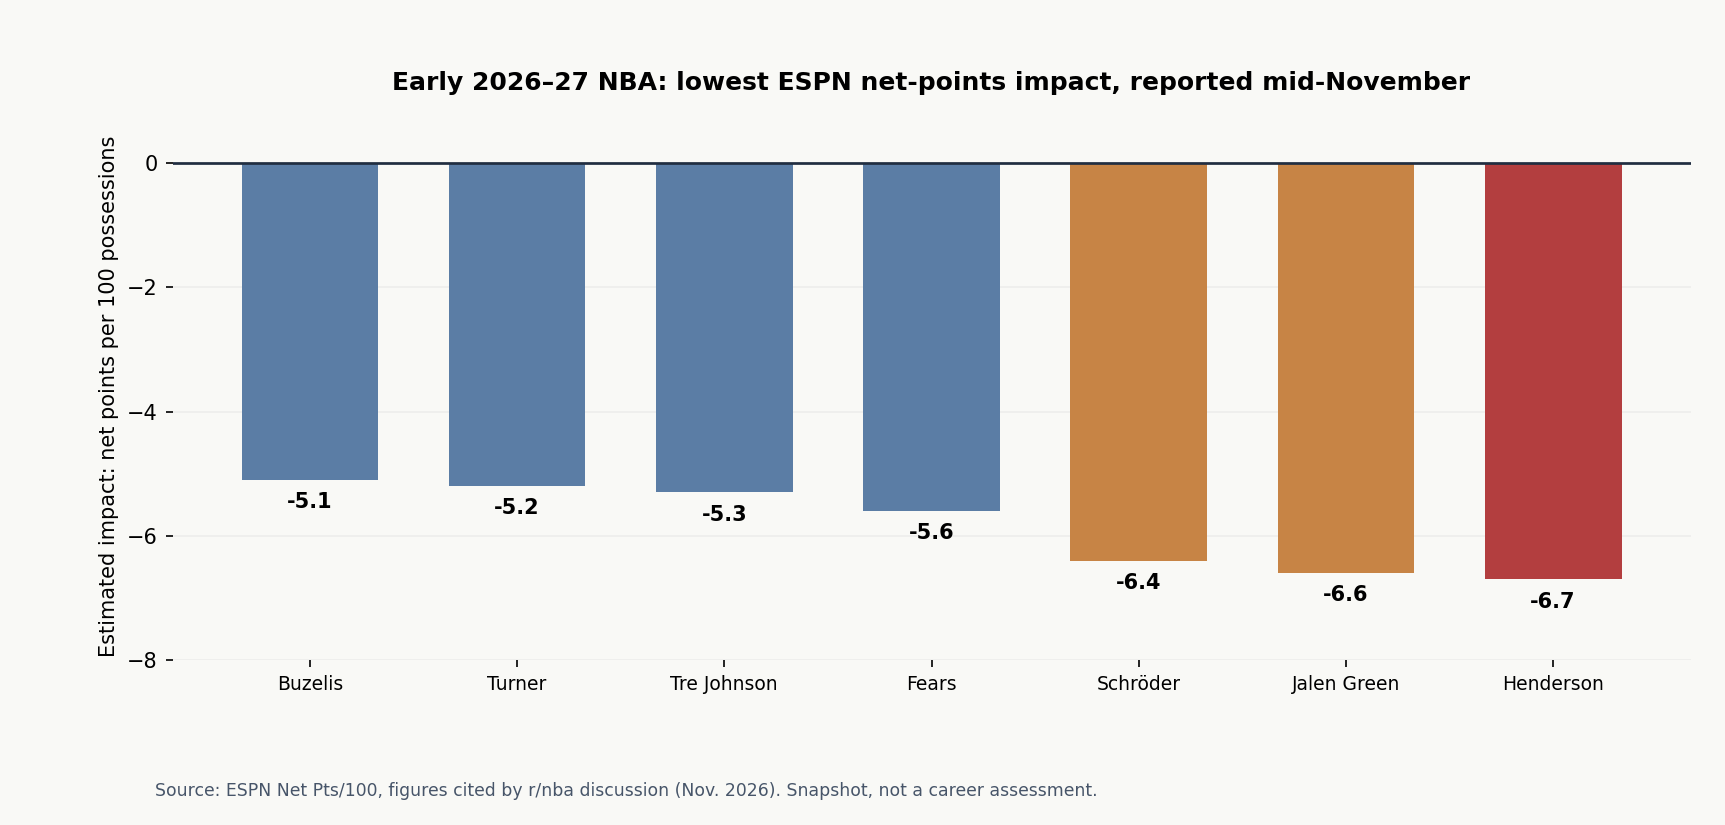
#7. Matas Buzelis, Chicago Bulls (−5.1 estimated points per 100)
Buzelis illustrates the danger of reducing a developing forward to one impact score. His early scoring average was 14.4 points per game, while a roughly 61% true-shooting mark reflects productive offense. Chicago’s lineups and defensive outcomes can still weigh on an adjusted team-impact estimate. His presence near the bottom is not proof of poor individual shooting or limited upside.
NBA Europe archival Buzelis scoring highlights from February 2026. Highlights provide historical context rather than direct evidence of current-season efficiency. Watch Matas Buzelis footage.
#6. Myles Turner, Milwaukee Bucks (−5.2 estimated points per 100)
Turner supplied important rim protection even while struggling offensively. Across 13 appearances in the cited snapshot, he averaged 7.4 points, 6.1 rebounds and 2.1 blocks, with a 46.6% true-shooting rate. The offensive slowdown deserves scrutiny, but blocks and paint deterrence do not necessarily appear in a single scoring-efficiency number. A low estimated impact is a warning sign rather than a complete defensive scouting report.
Independent All About the Bucks archival 2025–26 Turner highlights. Highlights provide historical context rather than direct evidence of current-season efficiency. Watch Myles Turner footage.
#5. Tre Johnson, Washington Wizards (−5.3 estimated points per 100)
Johnson’s rookie development has come with a demanding adjustment to NBA defensive rotations and shot selection. The young guard played approximately 23.3 minutes per game across 13 outings, with 46.2% true shooting. Washington has developmental incentives to give him possessions that an established contender might allocate differently. Short-term negative impact may coexist with substantial long-term shooting potential.
Official Washington Wizards 2025–26 Tre Johnson season-highlights reel. Highlights provide historical context rather than direct evidence of current-season efficiency. Watch Tre Johnson footage.
#4. Jeremiah Fears, New Orleans Pelicans (−5.6 estimated points per 100)
An early model can lag behind a rookie’s visible progress. Fears logged about 29.4 minutes per game through 15 appearances and a 52.2% true-shooting mark. On November 16, he recorded his first career triple-double with 19 points, 10 rebounds and 10 assists. The achievement directly challenges any simplistic declaration that he is among the league’s least capable players. His estimated impact was still negative at the cited snapshot.
NBA official archival Jeremiah Fears top-plays video from the 2025–26 season. Highlights provide historical context rather than direct evidence of current-season efficiency. Watch Jeremiah Fears footage.
#3. Dennis Schröder, Charlotte Hornets (−6.4 estimated points per 100)
A veteran point guard can be evaluated differently from a teenager learning the league. Schröder’s first nine games yielded about 10.2 points and 4.9 assists per contest, with 46.7% true shooting. A hamstring issue limited his subsequent availability, making an already small statistical sample harder to interpret. His playmaking experience remains relevant even during a rough shooting stretch.
NBA Europe archival highlights of German NBA players, including Schröder, published July 2026. Highlights provide historical context rather than direct evidence of current-season efficiency. Watch Dennis Schröder footage.
#2. Jalen Green, Phoenix Suns (−6.6 estimated points per 100)
Green entered the snapshot with scoring talent but inconsistent efficiency. In 13 games, his true-shooting mark stood around 49.9%, a concern for a guard whose offensive value depends heavily on creating points. Shot selection and lineup fit offer competing explanations. A slow opening stretch should be separated from his established ability to generate difficult baskets.
Official Phoenix Suns archival Jalen Green 2025–26 season-highlights compilation. Highlights provide historical context rather than direct evidence of current-season efficiency. Watch Jalen Green footage.
#1. Scoot Henderson, Portland Trail Blazers (−6.7 estimated points per 100)
Henderson ranked lowest in the circulated ESPN estimate, alongside the weakest true-shooting rate in the seven-player group, approximately 44.4%. He played about 22.2 minutes per game across 13 appearances. Finishing, outside accuracy and turnovers are areas to examine, but early struggles cannot establish a career ceiling for a young lead guard. Portland’s lineup context and future games could change the rating substantially.
Official Portland Trail Blazers archival Scoot Henderson 2025–26 top-plays video. Highlights provide historical context rather than direct evidence of current-season efficiency. Watch Scoot Henderson footage.
What a negative impact rating can, and cannot, prove
A net-points model attempts to summarize contribution to scoring margin, not distinguish every basketball skill. Team context, opponent quality, role, health and low-minute samples can change a player’s estimate. Buzelis’ efficient shooting and Fears’ triple-double offer immediate counterexamples to a literal “seven worst talents” interpretation. Compare our Maxey versus Curry statistical analysis and Wembanyama versus Dončić defense scouting report for different approaches to player value.
The ranking is a November snapshot, not a forecast. Numbers may change after every game. Age, role and playing time matter, as illustrated by our LeBron James and Cooper Flagg development comparison. The seven linked archival videos document each athlete’s ability to make positive plays, rather than proving a specific negative impact estimate.
Sources and dates: ESPN Analytics Net Pts/100 (methodology and live index); r/nba reproduction of ranking (reported seven-player order and values); StatsNext 2026–27 player statistics (season figures through November 17, viewed November 18, 2026); NBA and team channels for archival video. Figures are rounded.
Editor’s Note: NBA player-value estimates carry substantial uncertainty early in a season. Placement concerns one reported statistical snapshot and must not be confused with a judgment about character, professional merit or future ability. The cover is original conceptual artwork rather than a game photograph.
Support independent technical and sports data journalism
Readers can support original BitcoinVersus.Tech research with an optional 5,000-satoshi contribution. Review the recipient and amount in a compatible Bitcoin wallet before approving any payment. Mobile readers may save or long-press the QR image and open it in a wallet’s scanner, where supported.



Leave a Reply