
Internet connections are much faster in the OECD’s member economies than six years ago. According to the Digital Economy and Society Outlook 2026, published November 5, measured fixed-broadband download speeds increased from 54.4 megabits per second (Mbps) in Q2 2020 to 207.5 Mbps in Q2 2026. Yet metropolitan users continued to see average median download performance 42% above regions far from metropolitan areas. Fast nationwide progress can therefore coexist with substantial geographical differences.
CNBC’s 2022 Corning factory documentary explains why optical-fiber construction is challenging in rural areas. Background material, not footage of the OECD report. Watch the verified CNBC video.
The six-year speed gain, quantified
Dividing 207.5 Mbps by 54.4 Mbps gives 3.81 times the original download speed, equivalent to approximately 281% growth. The absolute increase is 153.1 Mbps. Upload measurements also improved dramatically, from 16.1 Mbps to 79.8 Mbps over identical quarters. Latency fell from 16.4 milliseconds to 10.3 milliseconds, or roughly 37%. Upload capacity improves video meetings and file backups, whereas lower latency helps interactive workloads such as calls and remote sessions.
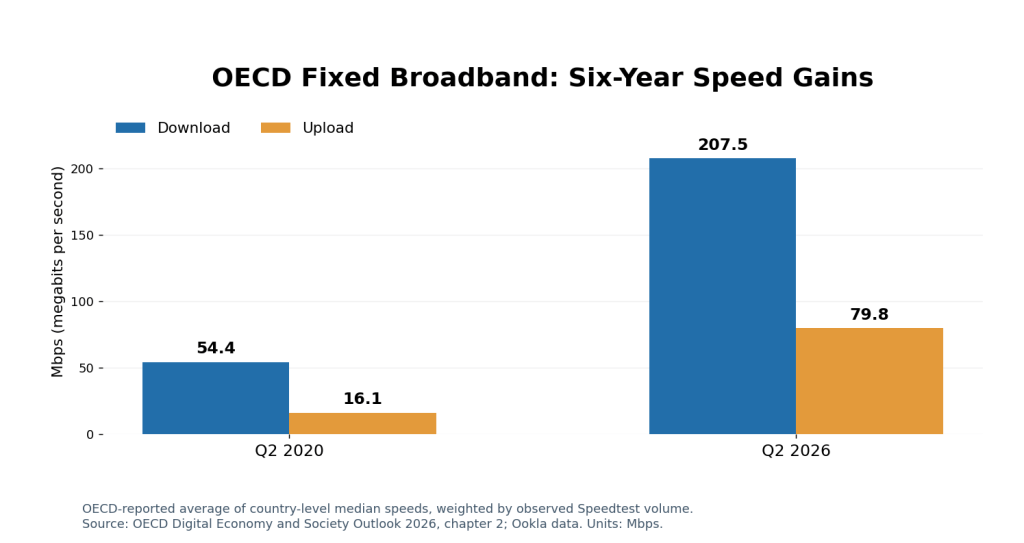
The OECD reports an average of national median speeds weighted by Ookla Speedtest test volume, rather than a guarantee for every household. Speed-test participants choose when to test, and results can reflect subscriber plan, router quality, home Wi-Fi and network conditions. A measured connection rate also differs from an Internet provider’s advertised maximum. Period, sample and units must be kept together to make meaningful comparisons.
Rural coverage lags by 20 percentage points
Among 28 OECD member countries with relevant coverage data, broadband networks capable of at least 100 Mbps were available to an average 85.9% of all households but just 65.8% of rural households during 2025. The difference is 20.1 percentage points. Availability does not establish whether the household purchased service or actually obtained 100 Mbps. In a separate measurement using Q2 2026 speed tests, metropolitan areas were 42% faster on average than remote regions.
Country results vary. The OECD identifies Chile, Finland and Norway as exceptions where regions far from metropolitan areas recorded higher speeds. Network coverage and achieved speeds also come from different underlying datasets, with distinct reporting periods. Presenting the two gaps as equivalent would therefore misstate the research.
CNBC’s January 2026 documentary follows Corning’s fiber manufacturing for AI data centers. Relevant to the wider fiber supply chain but not direct evidence about rural broadband speeds. Watch the original CNBC report.
Fiber expands, but the final mile remains expensive
Fiber reached 50.7% of OECD fixed broadband subscriptions in December 2025, compared with about 31% five years earlier. Fixed wireless access represented 5.8%, and satellite broadband slightly more than 1%. Optical, wireless and satellite infrastructure have different performance and installation constraints. A fiber-rich backbone cannot alone solve costly last-mile deployment to scattered homes.
Relevant BitcoinVersus.Tech technical coverage includes passive splitter and field-loss testing, Nokia’s 50G optical access card, 25G optical access equipment, and AT&T–Corning fiber deployment. Hardware improvements matter, but the OECD figures show why coverage and affordability deserve independent scorecards.
What to track next
The clearest future indicators combine actual download and upload speeds, latency, rural coverage, household subscriptions and affordability. Rising median speeds should be celebrated without treating a national average as universal access. New networks must reach places where the business case is hardest, while existing service must perform as advertised.
Primary references: OECD Digital Economy and Society Outlook 2026, chapter 2; OECD October broadband release. Ratios are calculated independently from published rounded values; observed speed and network-availability datasets are not interchangeable.
We volunteer daily to ensure the credibility of the information on the current platform is Verifiably True. If you would like to support to help further secure the integrity of our research initiative, please scan the QR code below.



Leave a Reply