
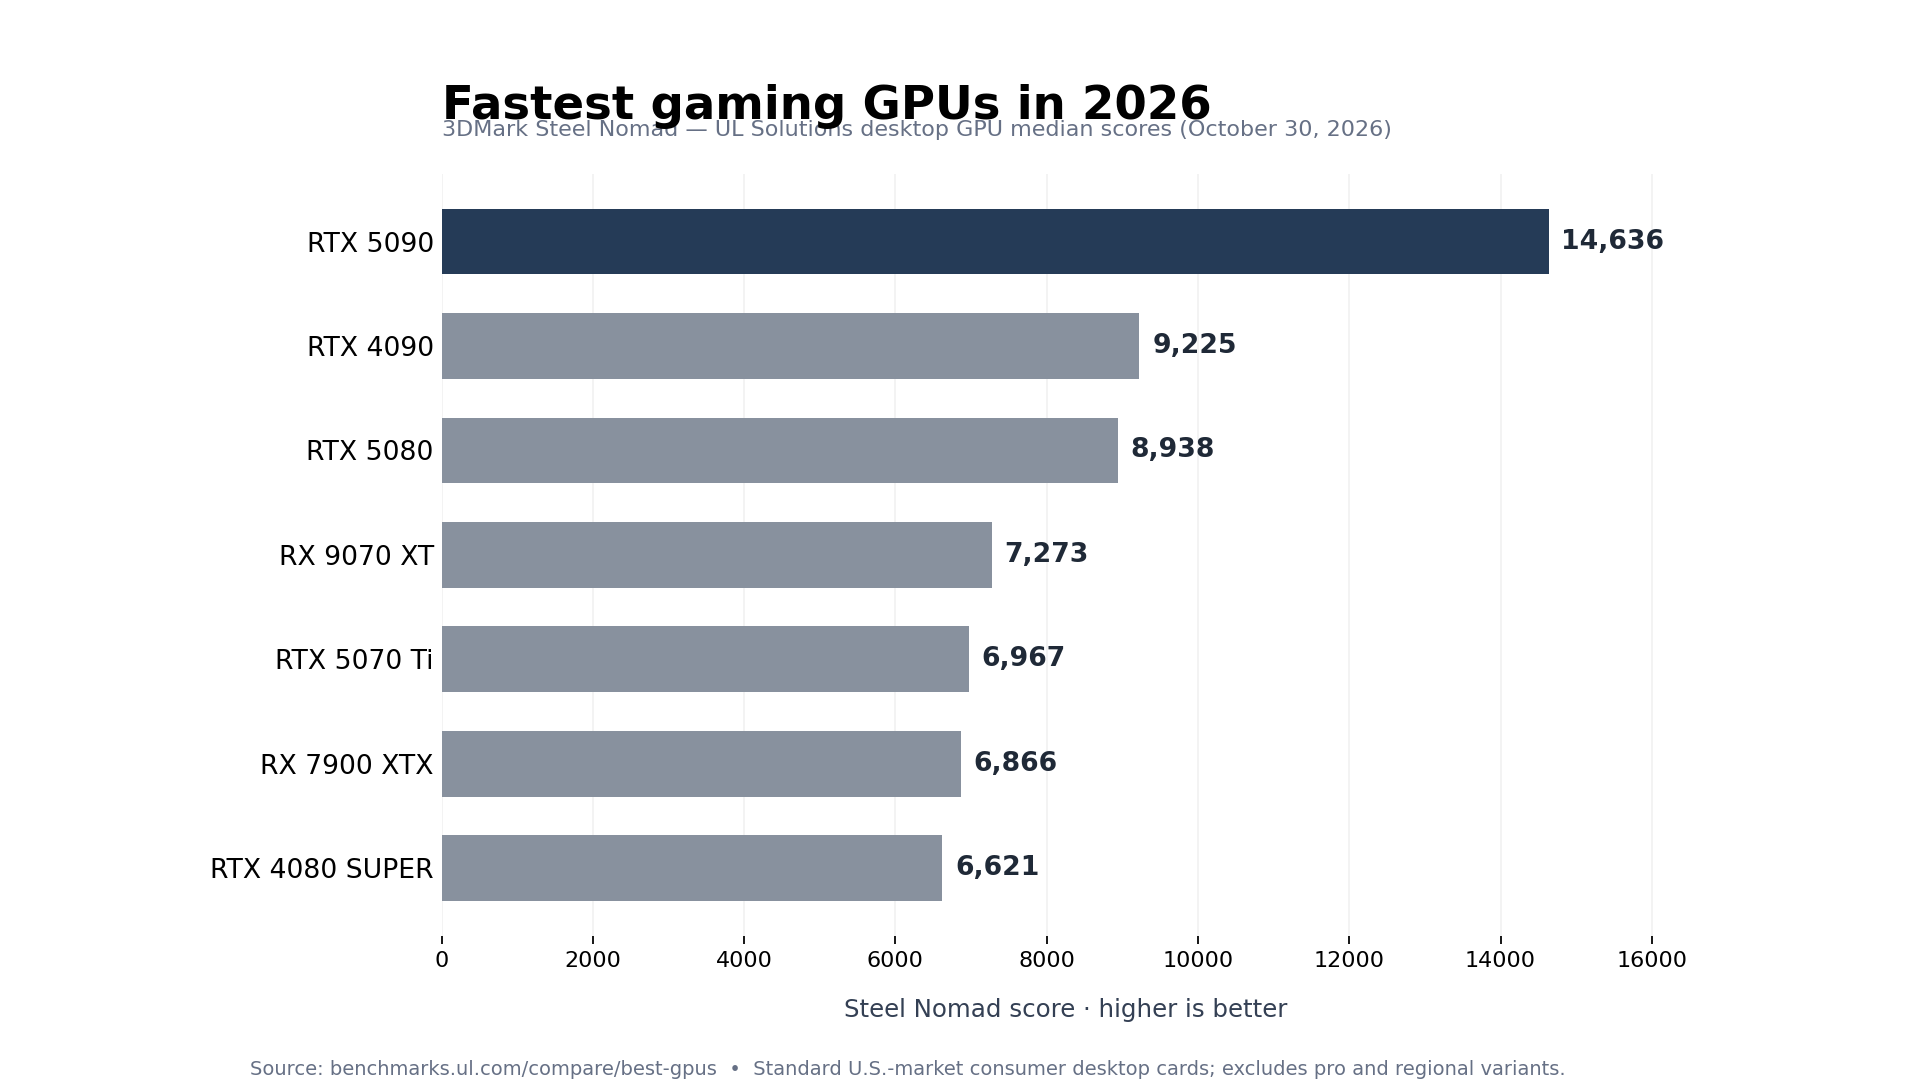
NVIDIA’s GeForce RTX 5090 still holds a commanding lead over the fastest standard desktop gaming graphics cards in October 2026. The top seven consumer cards span a 3DMark Steel Nomad median score of 6,621 to 14,636 points, revealing substantial differences in 4K graphics processing even among high-end models released years apart. AMD’s Radeon RX 9070 XT is the strongest non-NVIDIA contender by this particular benchmark.
BitcoinVersus.Tech ranked the cards by UL Solutions’ October 2026 median Steel Nomad scores, using one standard U.S.-market consumer desktop model per entry. We excluded professional graphics cards, notebook models and region-specific NVIDIA D variants. Scores are median results submitted by people running the benchmark, not a single controlled-lab test. This 4K DirectX 12 graphics test runs without ray tracing and does not measure frames per second in any individual game.
7. NVIDIA GeForce RTX 4080 SUPER — 6,621 Points
The GeForce RTX 4080 SUPER takes seventh at 6,621 points. NVIDIA launched it in January 2024 with 16GB of GDDR6X memory and a 320-watt reference graphics-power rating. It is only slightly ahead of the standard RTX 4080, whose 6,585-point median falls just outside this countdown. Both use Ada Lovelace architecture.
Hardware Unboxed’s RTX 4080 SUPER review tests game performance, ray tracing and power efficiency.
The 4080 SUPER remains a capable 4K card, particularly in games with access to NVIDIA’s DLSS upscaling and ray-tracing features. But this ranking gives it no bonus for those features; Steel Nomad is a raster workload. Its original $999 launch price should not be mistaken for a verified October 2026 street price.
6. AMD Radeon RX 7900 XTX — 6,866 Points
AMD’s Radeon RX 7900 XTX is sixth with 6,866 points. Launched in December 2022, it has 24GB of GDDR6 VRAM, a 384-bit memory interface and a typical board-power rating of 355W. Its generous memory capacity is attractive for high-resolution textures and memory-intensive work, though the gaming benefit depends on the application.
Gamers Nexus’ detailed Radeon RX 7900 XTX gaming, thermals, power and noise review.
The older RDNA 3 card narrowly outperforms the RTX 4080 SUPER in the selected median, but that ordering is not universal across games, especially when ray tracing is enabled. AMD’s 24GB VRAM advantage and NVIDIA’s differing software features must be considered separately from a synthetic raster score.
5. NVIDIA GeForce RTX 5070 Ti — 6,967 Points
The GeForce RTX 5070 Ti enters fifth at 6,967 points. NVIDIA’s Blackwell card pairs 16GB of GDDR7 with an advertised 300W total graphics-power limit. Its newer memory system and rendering architecture provide a middle ground between high-performance 1440p gaming and 4K play, while the 16GB frame buffer is less generous than the 7900 XTX’s.
Hardware Unboxed evaluates the RTX 5070 Ti across 1440p and 4K games, ray tracing and retail-price scenarios.
A roughly 101-point advantage over the 7900 XTX in this median test is too small to assume that the newer card always wins in real games. Product availability also varies: reports during 2026 questioned the model’s supply, making the original $749 suggested price an imperfect guide to actual purchase costs.
4. AMD Radeon RX 9070 XT — 7,273 Points
The Radeon RX 9070 XT is fourth at 7,273 points, leading AMD’s consumer cards on this list. Its RDNA 4 GPU has 16GB of GDDR6, 64 compute units and a 304W typical board-power rating. AMD introduced it at a $599 suggested U.S. launch price, substantially below NVIDIA’s upper-tier cards.
Hardware Unboxed’s Radeon RX 9070 XT review compares gaming performance, 4K results and ray tracing.
The 9070 XT scores around 4.4% ahead of the 5070 Ti in UL’s October medians. That modest gap does not establish a universal winner in games. However, on the manufacturer’s original launch price, the AMD card yields more Steel Nomad points per dollar than the RTX 5070 Ti; actual 2026 store prices must be checked independently.
3. NVIDIA GeForce RTX 5080 — 8,938 Points
The GeForce RTX 5080 rises to third with 8,938 Steel Nomad points. The Blackwell GPU uses 16GB of GDDR7 memory with a 960GB/s memory-bandwidth specification and a 360W total graphics-power rating. Its median is substantially above the RX 9070 XT’s, reflecting the performance step into NVIDIA’s higher-end design.
Hardware Unboxed tests the RTX 5080 in 1440p and 4K games, including ray-traced titles.
The RTX 5080 is aimed at gamers who need higher 4K rendering throughput, yet its 16GB capacity is lower than the 24GB available on the previous-generation RTX 4090 and RX 7900 XTX. The RTX 5080 does not reach the RTX 4090’s Steel Nomad score despite its newer architecture.
2. NVIDIA GeForce RTX 4090 — 9,225 Points
NVIDIA’s GeForce RTX 4090 holds second place with 9,225 points. Released in October 2022, the Ada Lovelace flagship carries 24GB of GDDR6X, a 450W reference total graphics-power figure and a wide memory interface. It remains ahead of the newer RTX 5080 in this test, illustrating how an older, larger flagship GPU can outrun a later-generation card sold at a lower tier.
Hardware Unboxed’s original RTX 4090 gaming review includes 4K frame-rate comparisons, ray tracing, power and cooling.
At just 287 points ahead of the RTX 5080, its advantage on the chosen UL median is around 3.2%. Neither result proves identical relative performance in current games. Buyers should also note that a legacy GPU’s historical MSRP or resale price is not the same as current market availability.
1. NVIDIA GeForce RTX 5090 — 14,636 Points
The GeForce RTX 5090 dominates at 14,636 points. NVIDIA’s Blackwell flagship has 32GB of GDDR7 memory, an advertised 1,792GB/s of memory bandwidth and a 575W total graphics-power rating. Its launch price was $1,999, making it a premium option in both purchase cost and power demand.
Gamers Nexus evaluates the RTX 5090 Founders Edition’s 4K gaming results, thermal performance, noise and power consumption.
The 5090’s UL median is 58.7% higher than the 4090’s and approximately 2.21 times the 4080 SUPER’s. That is a benchmark comparison, not a promise of 58.7% more FPS across all games. Performance gains may shrink with CPU bottlenecks, differ with ray tracing or shift when DLSS and frame generation are enabled.
What the Benchmark Reveals—and What It Cannot
The ranking measures raw throughput in one heavy 4K raster graphics workload. It intentionally does not incorporate ray tracing, AI-based frame generation, software compatibility, driver features, fan noise, heat, price or warranty quality. UL publishes the Steel Nomad median from user-submitted benchmark runs rather than an independently controlled comparison of every model under identical temperatures and clocks.
The upper end also carries a substantial electrical cost. The 575W RTX 5090 uses a higher advertised board-power budget than the 360W RTX 5080 or 304W RX 9070 XT. Those figures describe design ratings, not real-time metered energy use or frames per watt. Gamers who value their electricity consumption, cooler acoustics or purchase budget may make a different choice than the raw-performance ordering suggests.
At the original suggested prices, AMD’s $599 RX 9070 XT makes a compelling performance-per-dollar argument, while the RTX 5090 remains the outright Steel Nomad leader. The most meaningful buying decision should still start with the games being played, intended monitor resolution, available power supply and current local price. Related BitcoinVersus.Tech reporting has examined the RTX 5090 supply debate and how graphics processors differ from other compute chips.
BitcoinVersus.Tech
BitcoinVersus.Tech Editor’s Note: We volunteer daily to ensure the credibility of the information on this platform is Verifiably True. If you would like to support our work and help further secure the integrity of our research initiatives, please scan the QR code below to donate 5,000 sats. For best results, scan the QR code from a laptop or larger screen.
Bitcoin address: 3C9o19EH5HSiwEPyCTmEKzxhNCbo2X6TTb. Confirm the destination address before sending.

BitcoinVersus.tech is not a financial advisor. This media platform reports on financial subjects purely for informational purposes.


Leave a Reply