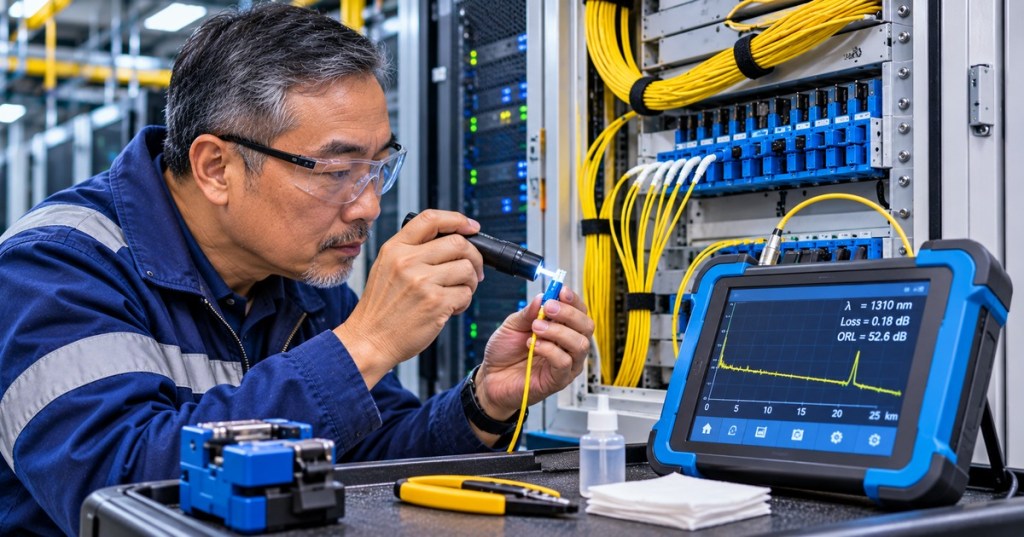
OSFOTC.016 teaches fiber-optic technicians how to distinguish suspected macrobend loss from microbend-induced stress, ordinary splice attenuation, and misleading OTDR measurements. The focus is dual-wavelength, single-mode optical time-domain reflectometry (OTDR): comparing the apparent loss of a physical event at 1310 nm and 1550 nm while preserving the test configuration, uncertainty, and cable records. A large loss difference may help locate a bend, but it is not a stand-alone diagnosis or a universal pass/fail limit.
The preceding OSFOTC.015 addressed splitters, PON optical-power budgets, and OTDR limitations. OSFOTC.008 introduced broad fault restoration. The new chapter examines differential event-loss calculations, test uncertainty, field evidence, and when a trace justifies escalation. The Fiber Optic Association (FOA), a nonprofit educational organization, provides an open explanation of macro- and microbending.
Learning Objectives, Background and Prerequisites
- Define macrobending, microbending, wavelength-dependent attenuation, and an OTDR event.
- Explain why single-mode bending commonly causes a larger incremental event loss at 1550 nm than at 1310 nm.
- Calculate the differential event loss ΔL = L1550 − L1310 and interpret an instrument-specific warning threshold correctly.
- Identify reasons a wavelength comparison can mislead: launch mismatch, pulse-width changes, reflective dead zones, noise, and fiber properties.
- Distinguish a suspected macro bend from a confirmed cable defect and avoid inferring microbending from one measurement.
- Complete a safe, documentation-only review of an event table and specify the next approved field test.
Prerequisites: single-mode fiber basics, optical power in decibels, connectors, launch and receive cords, and elementary OTDR traces. Review OSFOTC.004 on connector types, OSFOTC.003 on OTDR setup, and OSFOTC.007 on installation and bend radius. No energized testing or physical fiber manipulation is necessary for the classroom laboratory.
The Physics of Bending Stress
Macrobending occurs when fiber follows a relatively large geometric curve, such as a sharp corner or an overly tight loop in a cassette or patch panel. Curvature may allow some guided light to leak out of the core/cladding structure, increasing attenuation. The wavelength and the fiber’s construction matter, and the exact relationship is not a fixed number applicable to every cable. The FOA distinguishes these installation-scale bends from microbending, in which small deformations or pressures perturb the fiber over much shorter distances.
Microbending may be associated with localized compression, cable construction, temperature changes, tight tie-downs, or stresses from nearby components. A microbend need not have a visible sharp loop. The FOA notes that a simple, reproducible standard test specifically for microbending is not available, so a technician should not assume that all wavelength-sensitive loss represents the same physical mechanism.
Bend-insensitive single-mode fiber designed to ITU-T G.657 categories can improve resilience to tight routes, but the installed cable, connector, jacket, pulling-tension specification, and manufacturer minimum bend radius still govern safe handling. A bend-insensitive fiber is not a license to kink a cable. The FOA’s bend-insensitive-fiber lesson summarizes the distinction between conventional and improved-bend fiber.
Why Compare 1310 nm and 1550 nm?
In many conventional single-mode fiber systems, ordinary distributed attenuation per kilometer is lower at 1550 nm than at 1310 nm. However, a localized bending event can show the opposite wavelength trend: a larger extra loss at 1550 nm. These two statements describe different effects and must not be confused. Comparing two event losses at the same distance removes much of the long-span attenuation context and helps the operator search for a wavelength-sensitive feature.
The FOA’s OTDR field-test examples show a physically introduced bend that produces a substantial nonreflective step at 1550 nm and little corresponding feature at 1310 nm. EXFO’s OTDR user guide (macrobend parameters, printed page 40) documents a software rule that requires both a larger loss at the longer wavelength and a loss difference greater than a configured delta. Its illustrative default is 0.50 dB, but the setting can be changed and must not be represented as a universal industry limit.
Fiber Optic Association, “Using An OTDR,” September 14, 2012. Open educational demonstration of instrument setup and the effects of test parameters on OTDR traces. Source: thefoainc official education channel.
Reading an OTDR Event Without Inventing a Defect
An OTDR sends optical test pulses and measures returning backscatter and reflections to infer distance, splice attenuation, and changes along a fiber. A sharp nonreflective step can indicate a fusion splice, stressed bend, or other nonreflective loss event. A strong reflection peak more often indicates a connector, a mechanical interface, or a break. The event table is not a substitute for map and work-order evidence: use the same fiber ID, launch configuration, known routing, and local acceptance criteria as the baseline test.
A bent cable can be close to the start of a spool, behind a patch tray, in an enclosure, or at an over-tight service loop. However, a suspected event’s reported distance can be offset by the instrument’s refractive-index setting and the physical route of the cable. Technician records should distinguish optical distance from a proven cabinet, splice tray, or pedestal location. Refer to the FOA OTDR reference for backscatter, event loss, and instrument uncertainty.
Worked Example: Four Hypothetical Events at Two Wavelengths
The following four event-loss pairs are synthetic classroom numbers, not field measurements by EXFO or the FOA. Assume event positions have been aligned and the two test captures have comparable settings and adequate signal-to-noise ratio. For every event, calculate ΔL = L1550 − L1310. Positive ΔL indicates more apparent event loss at the longer wavelength.
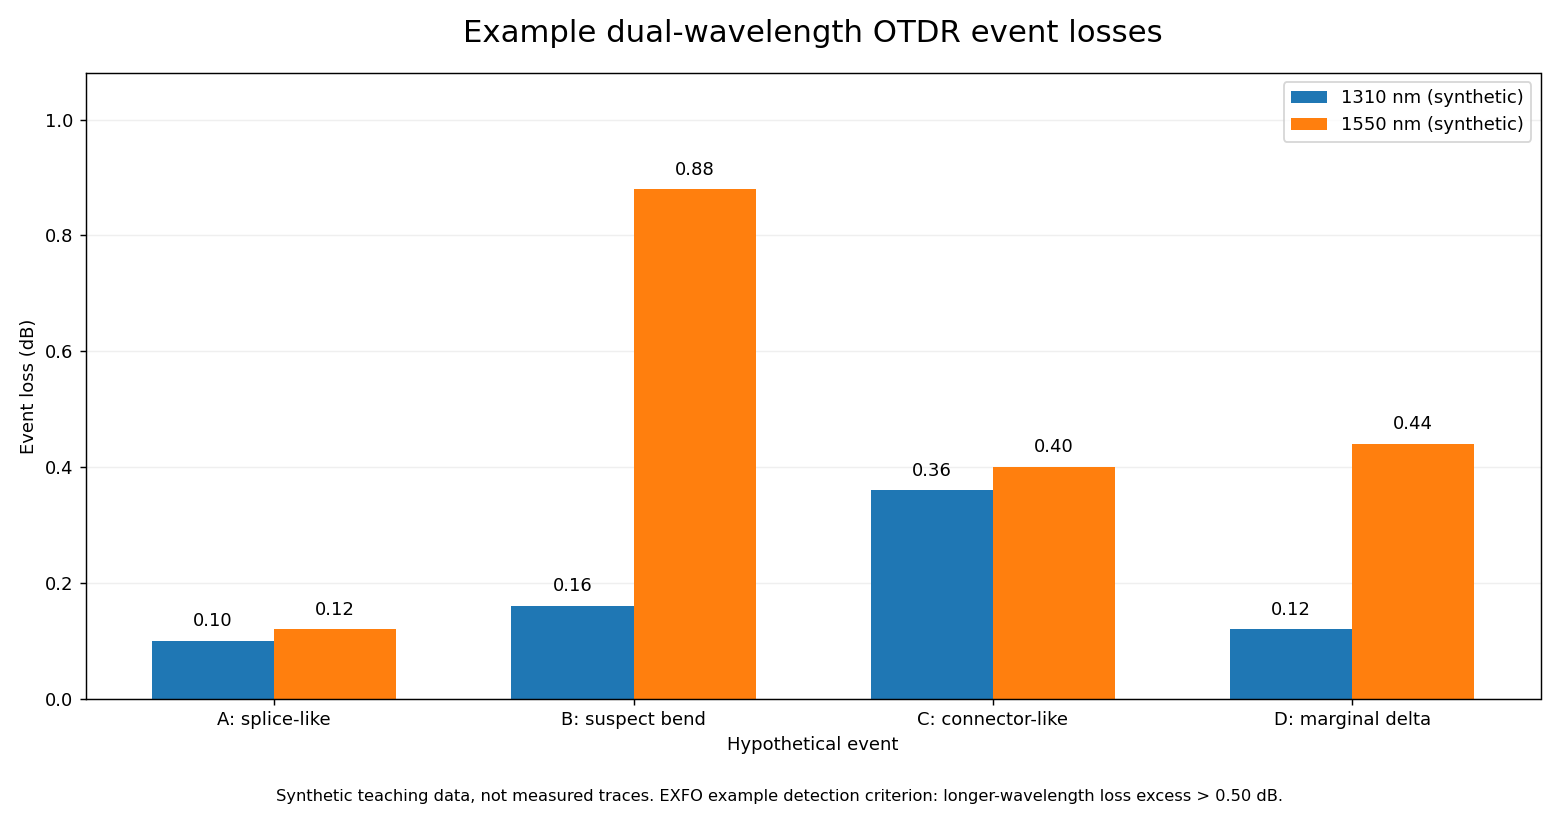
- Event A, splice-like: 0.10 dB at 1310 nm and 0.12 dB at 1550 nm. ΔL = +0.02 dB; little wavelength separation is visible.
- Event B, suspected macrobend: 0.16 dB at 1310 nm and 0.88 dB at 1550 nm. ΔL = +0.72 dB, exceeding a hypothetical 0.50 dB software threshold.
- Event C, connector-like: 0.36 dB at 1310 nm and 0.40 dB at 1550 nm. ΔL = +0.04 dB; the absolute loss and reflectance still require inspection.
- Event D, marginal difference: 0.12 dB at 1310 nm and 0.44 dB at 1550 nm. ΔL = +0.32 dB; this does not exceed the example 0.50 dB flag, but the event is not automatically healthy.
For Event B, 0.88 − 0.16 = 0.72 dB. A 0.72 dB additional loss corresponds to a relative power ratio of 10−0.72/10 ≈ 0.847, or approximately 15.3% less transmitted power than a reference with only the 1310 nm event loss, under the mathematical comparison’s assumptions. That is not a claim about actual transmitted power in a live PON; many other losses exist along a real link.
The four deltas were checked in Python as 0.02, 0.72, 0.04 and 0.32 dB. A software flag tells the operator where to investigate, not what replacement is authorized. It is particularly important to separate the macrobend detection setting from the cable plant’s approved insertion-loss budget. A pass in one category does not establish a pass in the other.
Practical Differences Between Macrobend and Microbend
Macrobends are often associated with visible routing geometry: a tight loop in a fiber tray, a low-radius corner, a sharp cabinet entry, or cable storage that violates the cable manufacturer’s requirements. Their signatures may be wavelength sensitive. Microbending can arise from small distributed stresses that are harder to localize visually and may change as temperature, cable pressure or strain change. A technician should compare affected fibers and environmental history before concluding that an invisible microbend is present.
The manufacturer’s published cable or fiber bend-performance data is relevant. For example, Corning’s bend-insensitive fiber technical information contains geometry and bend-loss specifications for particular specialized products. Such specifications describe test conditions, not a promise that any finished field cable can be forced around a 5 mm bend radius.
Why Two Captures Can Disagree for the Wrong Reason
- Different pulse widths: one acquisition may resolve a narrow event while another merges it with a neighboring connector or dead zone. Compare stored acquisition settings rather than looking only at two loss numbers.
- Wrong launch or receive cable: deteriorated or incompatible reference connectors can raise initial loss, increase reflection, or hide nearby events.
- Instrument uncertainty: small event-loss differences may fall within measurement uncertainty or depend on backscatter coefficient changes.
- Different fiber ID or distance scale: two traces from the wrong port or a different index-of-refraction setting cannot be safely compared event-for-event.
- Reflective-event saturation: a large peak may distort the apparent step and subsequent events; a short pulse or adjusted setup may be required under an approved procedure.
- Different fiber construction: G.657 bend-insensitive fibers and conventional G.652 spans may respond differently to tight routing.
- Active-service conflicts: an OTDR connected to a live optical path without an appropriate rated filtered live-fiber port may produce invalid results or damage test equipment.
The FOA cautions that OTDRs are not direct insertion-loss meters. Link attenuation acceptance is typically verified with an optical light source and power meter or an approved optical-loss test set (OLTS), while an OTDR is used to localize events and characterize fiber features. Use OSFOTC.009 to review certification versus fault-location roles.
Specialized Products Company, “EXFO Optical Explorer OX1 — How to Find Macrobends with Fault Explorer,” September 6, 2024. Public instructional product demonstration using 1310/1550 nm and event-location reporting; the video is from an equipment reseller, not FOA or EXFO’s official channel.
Safety Before Any Real Fiber Test
Never look into a fiber end or microscope that is not specifically safe for optical inspection, and never assume a connector is dark simply because no visible light is present. In particular, optical communication wavelengths such as 1310 nm and 1550 nm are invisible to the human eye. Confirm the assigned circuit, maintenance authorization, and optical-source state before handling or disconnecting any path. Use suitable power detection and the specific manufacturer’s safety instructions.
The EXFO live-fiber warning article identifies incorrect port selection and input optical power as causes of invalid acquisitions and possible instrument damage. Never add a bend, kink or unapproved mandrel wrap to an unidentified active cable to see whether an alarm changes. Any physical re-routing, cleaning, splicing or replacement belongs under an authorized site procedure and change-control record.
Safe Engineering Review and Escalation Workflow
- Establish scope. Record the work order, fiber pair, circuit or PON branch, service impact, current route drawings, known splice locations and previous acceptance results.
- Verify authorized status. Classify the optical path as dark or operational, confirm whether a live-fiber-capable filtered test port is specified, and follow site lockout and optical-safety rules.
- Preserve baseline traces. Keep the original raw test files, wavelength, acquisition time, pulse width, index of refraction, launch/receive fiber length and software revision.
- Compare matched events. Align event positions, calculate L1550 − L1310, and check whether any alert is an instrument default or a documented project-specific setting.
- Evaluate uncertainty. Review source noise, reflective-event dead zones, test-port cleanliness, backscatter differences, and expected wavelength-dependent fiber attenuation.
- Correlate with physical records. Determine whether the suspect distance corresponds to an approved service loop, splice closure, tray, duct transition or another documented route element.
- Escalate findings. Have a qualified team approve any hands-on inspection, repair or re-test. Preserve before/after results and the exact component ID in the handoff record.
Documentation-Only Practical Lab
Download or review the FOA’s publicly available kink and wavelength-sensitivity example, and watch the two educational videos. Without attaching a test instrument or touching any live fiber, build a four-row spreadsheet using the synthetic Event A–D values above. Compute ΔL and add columns for “suspected fault type,” “measured or simulated,” “threshold source,” and “evidence still needed.”
For Event B, calculate 0.72 dB and note that the illustrative 0.50 dB rule would flag the event. For Event D, calculate 0.32 dB and explain why it still deserves review when service budgets, original traces, or local acceptance criteria indicate a problem. Write a five-sentence service ticket that cites the synthetic nature of the numbers, the wavelength difference, unknown route location, and the need for authorized physical confirmation.
Knowledge Check and Answers
- What is the practical distinction between macro- and microbending? Macrobending involves larger-radius routing curvature or kinks; microbending involves small-scale deformation or pressure along the fiber.
- Why is 1550 nm useful for diagnosing many single-mode bends? Incremental bend loss can be greater at longer wavelengths, even though normal span attenuation may be lower at 1550 nm.
- What is ΔL for Event B? 0.88 dB − 0.16 dB = 0.72 dB.
- Does a 0.72 dB difference prove a cable is kinked? No. It indicates a wavelength-dependent loss difference that should be correlated with physical routing and valid captures.
- Is 0.50 dB a universal fiber acceptance threshold? No. The figure is a configurable example in EXFO’s macrobend detection rule, distinct from project specifications.
- Can an OTDR replace end-to-end insertion-loss certification? Not universally. A source/power-meter or OLTS test is commonly used for direct insertion-loss acceptance.
- What does a missing alert at Event D establish? Only that the chosen example threshold was not crossed; the event may still merit investigation.
- What is the safest first action when the test fiber may be active? Stop before connecting or disconnecting, identify the service and approved live-test configuration, and follow the facility’s qualified optical-safety process.
References and Further Study
Fiber Optic Association: Macro- and Micro-Bending Fiber; FOA: OTDR Questions and Real Test Examples; FOA: Optical Time Domain Reflectometers; FOA: Bend-Insensitive Fiber; EXFO: OTDR User Guide, Macrobend Detection Section; EXFO: OTDR Glossary; and EXFO: Live Fiber Detected Guidance. Device-specific manuals and site standards take priority over the general examples.
In OSFOTC.016, the engineering distinction is between a screening observation, a probable bend-related hypothesis, and a confirmed physical route fault. Wavelength comparisons support fault localization, but correct test settings, uncertainty review, existing records and safe site procedures determine what can responsibly be concluded.
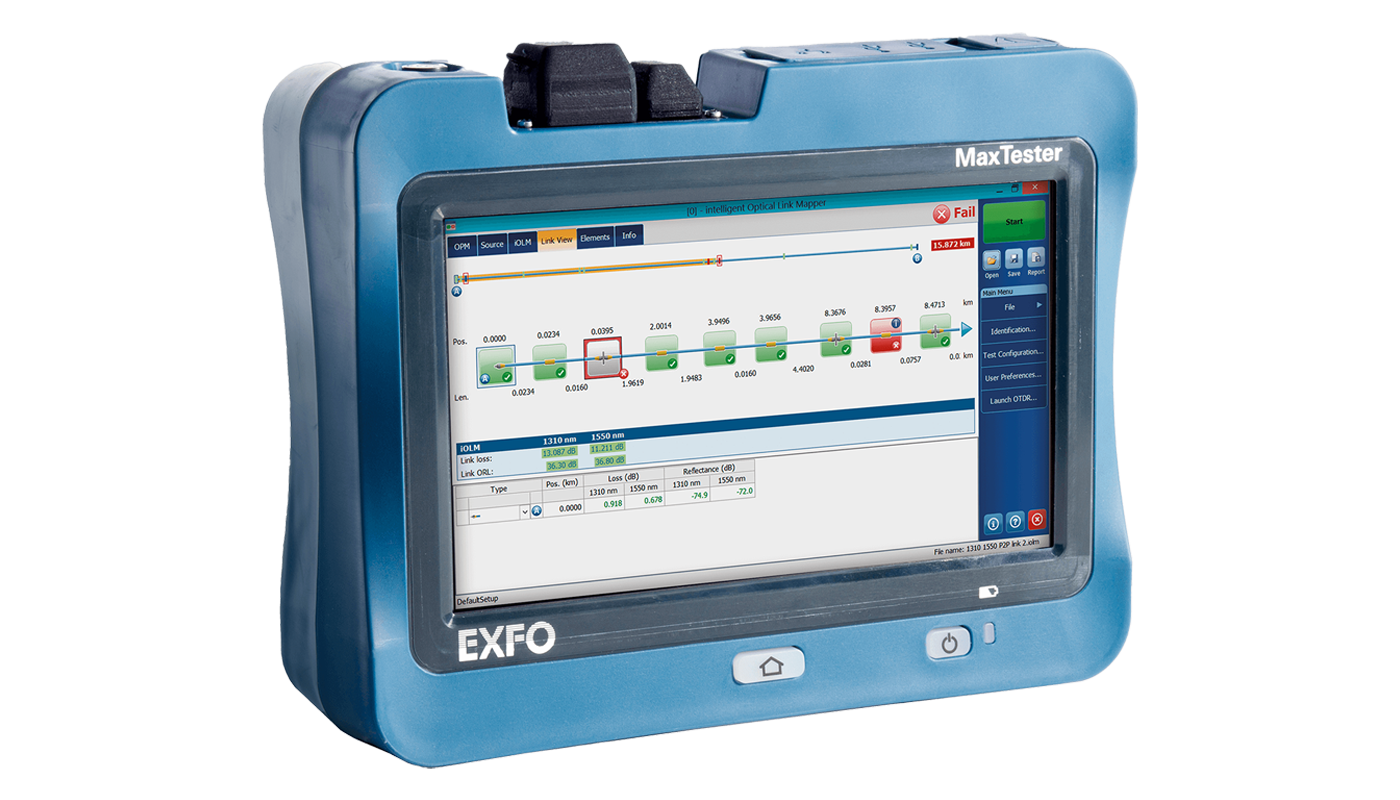
Editor’s Note: OSFOTC.016 follows published OSFOTC.015. The 1200 × 630 cover is an original conceptual AI-generated editorial image, not a documentary photo. The EXFO instrument photo is manufacturer imagery. The grouped bar chart contains four explicitly synthetic examples and was calculated in Python; no real field OTDR readings were acquired or cables physically manipulated. The FOA education video and the independent EXFO-equipment demonstration are credited to their actual uploaders. Video iframe presence can be checked through rendered WordPress HTML; live playback and pixel-level visual checks require separate confirmation.

To scan on a mobile device, open the lesson on a second screen and scan the QR with a compatible Bitcoin wallet, or use a wallet’s saved-image QR scanner if available. Verify the receiving address and 5,000-sat amount before authorizing a payment.
We volunteer daily to ensure the information on this platform is Verifiably True. If you would like to support the research, please scan the QR code.
BitcoinVersus.Tech provides educational and technical reporting. Optical-network service, laser safety and maintenance decisions must follow qualified personnel and applicable equipment procedures.


Leave a Reply