
Elementary Overview
OSFOEC.015 teaches engineers how an optical fiber can help measure stretching along a bridge, pipeline, tunnel or buried cable. A long strand of glass becomes a line of sensing locations rather than a single point sensor. Laser light changes in a measurable way when the fiber becomes warmer or undergoes mechanical strain. The difficult part is deciding how much of the change came from temperature and how much came from stretching.
The preceding OSFOEC.014 Raman temperature-sensing lesson described a different scattering mechanism used primarily for temperature. Brillouin distributed sensing can respond to both temperature and strain, so engineers need an independent temperature measurement or another calibrated method to distinguish the two. The goal is to obtain defensible measurements, not merely a colorful plot or an alarm.
Learning objectives: explain Brillouin scattering, distinguish BOTDA and BOTDR, compute a temperature-corrected strain estimate, describe calibration and spatial-resolution limits, and design a safe validation and reporting workflow. Numeric examples below are hypothetical classroom data, never measurements from an operating bridge.
OZ Optics manufacturer video: Comparison of BOTDR and BOTDA Systems. The source identifies both instrument methods and provides a practical introduction to the engineering tradeoffs. Official OZ Optics video page.
Brillouin scattering and the frequency shift
Light traveling inside silica fiber interacts weakly with acoustic waves in the glass. Some scattered light has a slightly different optical frequency. The separation between the launched light and a Brillouin-scattered component is called the Brillouin frequency shift (BFS). Near 1550 nm, a characteristic BFS in ordinary silica single-mode fiber is often around 10 to 11 GHz, but the precise value depends on glass composition, fiber design, temperature and strain.
Temperature and mechanical deformation change material properties and acoustic velocity, shifting the measured Brillouin spectrum. An instrument analyzes the spectrum at different positions along the fiber to estimate a distributed profile. The open-access review of Raman and Brillouin distributed sensing describes typical, approximate temperature sensitivity near 1 MHz/°C and strain sensitivity near 0.05 MHz per microstrain (µε) in standard silica fiber. Those values illustrate scale, not universally valid calibration coefficients.
A microstrain is one part per million change in length: 1 µε = 10−6 strain. A fiber segment 1 m long increasing by 50 µm has undergone 50 µε average axial strain, assuming its original length was 1 m and deformation is distributed uniformly. Fiber bonded to a structure may transfer deformation differently from a loose fiber resting inside a protective tube. The transfer mechanics matter as much as the optical response.
BOTDA versus BOTDR
Brillouin optical time-domain analysis (BOTDA) typically launches a pump and probe from opposite ends of a sensing fiber and observes stimulated Brillouin gain or loss. The pump-probe frequency difference is swept across the Brillouin spectrum to determine the frequency shift at successive positions. BOTDA usually requires access to both ends or an engineered loop arrangement; loop and connector losses affect performance.
Brillouin optical time-domain reflectometry (BOTDR) typically observes spontaneous Brillouin backscatter returning toward an interrogator, allowing access from one fiber end. Spontaneous signals can be weaker and may require averaging or more sophisticated detection. Neither acronym by itself guarantees a particular reach, sampling rate, precision or spatial resolution. Refer to the specific instrument model and measurement configuration.
A review published by the Fiber Optic Association places distributed sensing among several fiber-sensor technologies. For an engineering foundation in ordinary optical reflectometry, revisit OSFOEC.013 on bidirectional OTDR. An OTDR’s conventional reflection/loss trace must not be interpreted as a calibrated Brillouin strain measurement.
VIAVI Solutions manufacturer video: BOTDR DTSS Brillouin Optical Reflectometer: Monitoring Fiber Optic Strain and Temperature. Source: VIAVI’s original YouTube video. Product demonstrations should not be confused with independent field-validation data.
Real sensing equipment and the fiber installation
Commercial instruments illustrate the difference between a research concept and physical hardware. The Neubrex NBX-7000 product family combines Brillouin and Rayleigh sensing capabilities, with different configuration options and a manufacturer-described maximum reach of up to 25 km. Such product specifications are vendor claims; actual performance depends on the model, pulse settings, signal conditions and cable layout.
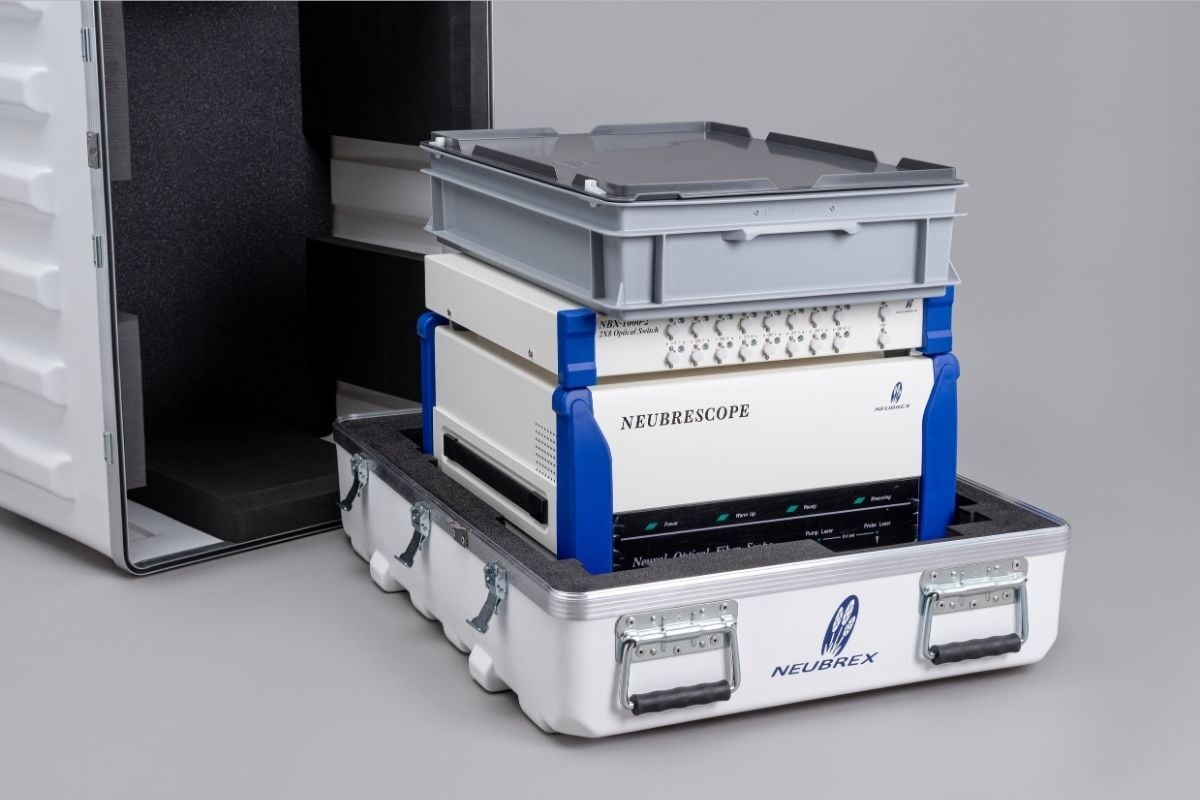
Select sensing cable as an engineering system, not an afterthought. A bonded strain-sensing cable must transfer deformation reliably; loosely supported fibers can be useful as temperature references because little structural strain is transferred to the sensing glass. Protective sheaths, adhesive creep, bends, attachment points, slack, thermal expansion, vibration and long-term aging affect the inferred strain. An excellent-looking Brillouin trace does not prove an appropriate mechanical coupling design.
The measurement equation and temperature cross-sensitivity
Over a calibrated range, a first-order approximation at a fixed sensing location is ΔνB = CT ΔT + Cε Δε, where the measured frequency shift ΔνB is in MHz, temperature change ΔT in °C, strain change Δε in µε, and the coefficients CT and Cε use matching units. The baseline must correspond to the same fiber and location; coefficients must come from calibration or a justified instrument-and-fiber specification.
The peer-reviewed railway-bridge monitoring study reports example coefficients of CT = 1.07 MHz/°C and Cε = 0.0497 MHz/µε for the fiber used by its researchers. The figures below use those published values only as a worked numerical assumption. Another fiber or installation may require different coefficients.
Worked example: a hypothetical sensor location exhibits a Brillouin frequency increase of 4.60 MHz relative to its baseline. An independent, properly aligned temperature reference reports a 2.00°C increase. The part predicted from temperature is 1.07 × 2.00 = 2.14 MHz. The residual shift attributed to strain is 4.60 − 2.14 = 2.46 MHz. Dividing by the example strain coefficient gives Δε = 2.46 / 0.0497 ≈ 49.5 µε.
Without the temperature reference, naively assigning the full 4.60 MHz shift to strain produces approximately 92.6 µε, almost twice the corrected estimate. Conversely, a genuine 10°C warming could create 10.7 MHz of shift and mimic approximately 215 µε if the temperature term were ignored. Real results require calibration uncertainties, spatial registration, repeatability and a defensible mechanical model.
Methods for separating temperature from strain
One approach uses a separate reference fiber that responds to temperature but is mechanically isolated from the host structure. Its temperature estimate is subtracted from the combined response of the bonded fiber after confirming that both locations experience comparable thermal conditions. A poorly positioned reference can create errors where a sunlit deck, shaded cable tray or deeply buried cable has different temperatures.
A second approach combines different sensing mechanisms or fiber types with independent sensitivities. Researchers have reported multi-core fibers, dispersion-compensating fibers, hybrid Brillouin/Rayleigh sensors, and coating-dependent responses. A single Brillouin frequency measurement gives one equation for two unknowns; the second independent observable is essential for a unique solution. The open-access study of Brillouin sensing cables discusses strain transfer and sensing-fiber design.
Do not confuse intrinsic temperature cross-sensitivity of the Brillouin response with actual thermally driven mechanical strain of a bridge or pipe. The latter can be physically real, even after sensor-temperature compensation. Structural engineers may need to separate elastic loading, restrained thermal expansion, creep and settlement using additional sensors and structural models.
OZ Optics manufacturer video: Simultaneous Measurement of Strain and Temperature Using a Dual Core Fiber. See the original manufacturer-hosted video for the technique and hardware context.
Spatial resolution, sampling and location accuracy
In a simplified pulse-based ranging picture, optical distance resolution scales approximately as Δz ≈ vg τ / 2, where vg is group velocity in glass and τ is effective pulse duration. Using a group velocity around 2 × 10⁸ m/s, a nominal 10 ns pulse corresponds to about 1 m of two-way distance. Actual Brillouin spatial resolution also depends on spectral linewidth, pulse shaping, signal processing and the selected measurement approach.
Data may be sampled every 0.2 m without providing independent 0.2 m spatial resolution. Similarly, a measured event at 3.000 km of fiber length is not automatically at the 3.000 km marker on a road or bridge. Cable slack, loops, helixes, routing detours and surveyed attachment points transform fiber distance into asset coordinates. The prior fiber end-face inspection lesson covers one source of avoidable connection and test quality problems.
Engineering acceptance and validation
A defensible commissioning plan contains repeatable controls before any alarm threshold is approved:
- Record the baseline: manufacturer model, software version, fiber type, cable installation, attachment method, optical route, map coordinates, temperatures, dates and conditions.
- Check optical integrity: inspect and clean approved connections; review the reflectance and return-loss results and any relevant bending diagnosis before treating a change as structural deformation.
- Calibrate: determine location-dependent baseline frequency and temperature/strain coefficients using reference measurements and suitable controlled fixtures.
- Separate influences: specify the independent temperature reference, cable strain transfer model, thermal exposure mismatch, and procedure for rejecting poorly coupled segments.
- Measure repeatability: log measurement interval, spatial resolution, spatial sampling, signal-to-noise behavior, frequency-fit quality and replicate traces.
- Cross-check: compare representative sensing locations with physical strain gauges, displacement instruments, surveyed movements or independently calibrated reference sensors.
- Report uncertainty: distinguish instrument precision, calibration uncertainty, positional error, environmental drift, and structural-model uncertainty.
- Escalate safely: use approved work permits and operator instructions; do not access active telecom fibers, remove protective trays or modify structural instrumentation without authorization.
Sensing data may reveal a pattern worthy of investigation; it rarely identifies the underlying structural defect by itself. A gradual frequency shift could indicate load, temperature drift, cable coupling changes or baseline instability. The optical performance monitoring lesson explains why trends must be interpreted with an engineering model rather than an isolated alarm.
Applications, limits and knowledge check
Published applications include monitoring bridges, railways, tunnels, geotechnical reinforcement, power cables and pipelines. High-voltage environments particularly benefit from a passive dielectric fiber sensor where appropriate. However, sensing hardware requires a compatible interrogation architecture, protected optical interfaces, reference data, operator expertise and maintenance funding. Performance advertised for an interrogator cannot be assumed for any arbitrary installed cable.
Question: Can a 5 MHz Brillouin frequency change prove that a beam stretched? Answer: No. Temperature and strain both alter BFS, and the fiber may not transfer structural motion reliably.
Question: What distinguishes BOTDA from a typical BOTDR? Answer: BOTDA generally measures pump-probe stimulated Brillouin interaction using two-ended access, while BOTDR generally measures spontaneous Brillouin backscatter from one end.
Question: Does a 0.5 m data interval prove 0.5 m spatial resolution? Answer: No. Spatial sampling and independent measurement resolution are different specifications.
References
- Application of Raman and Brillouin Scattering Phenomena in Distributed Optical Fiber Sensing, open-access scientific review.
- Optical Fiber Sensing Cables for Brillouin-Based Distributed Measurements, research on fiber and mechanical coupling.
- Monitoring a Railway Bridge with Distributed Fiber Optic Sensing Using Specially Installed Fibers, published field-study coefficients and measurement context.
- OZ Optics distributed strain and temperature instrument documentation and video collection.
- Neubrex NBX-7000 official technical overview.
Elementary Conclusion
A fiber-optic sensor can watch many locations along an asset and reveal where the glass is stretching or warming. Brillouin equipment detects changes in light associated with both effects, so an engineer uses a reference and verified calibration to avoid mistaking heating for strain. The most valuable result is a traceable, correctly located measurement with known limits, not merely a large number on an instrument.
Editor’s Note: Technical discussion was checked against open scientific literature, the Fiber Optic Association and manufacturer documentation. The numeric coefficients and arithmetic example are explicitly attributed and hypothetical; no physical strain test, bridge inspection or power-cable intervention occurred. The original 1200 × 630 featured cover uses detailed AI-generated colored-pencil editorial illustration and the required neon-green BitcoinVersus.tech black-background wordmark. The in-body photo is credited authentic manufacturer media. Official video IDs were located from manufacturer source pages, but independent video playback and mobile-screen visual verification have not yet been performed.

BitcoinVersus.Tech is volunteer-run and publishes independent technology education. An optional 5,000-satoshi contribution supports research. Scan the original QR on a second screen or import the QR as an image into a compatible Bitcoin wallet. Independently confirm recipient 3C9o19EH5HSiwEPyCTmEKzxhNCbo2X6TTb and the amount before authorizing a generally irreversible Bitcoin transaction.
We volunteer daily to ensure the information on BitcoinVersus.Tech is Verifiably True. Educational lessons do not authorize live network operations, structural repairs, laser work or field acceptance without qualified supervision and approved site procedures.


Leave a Reply