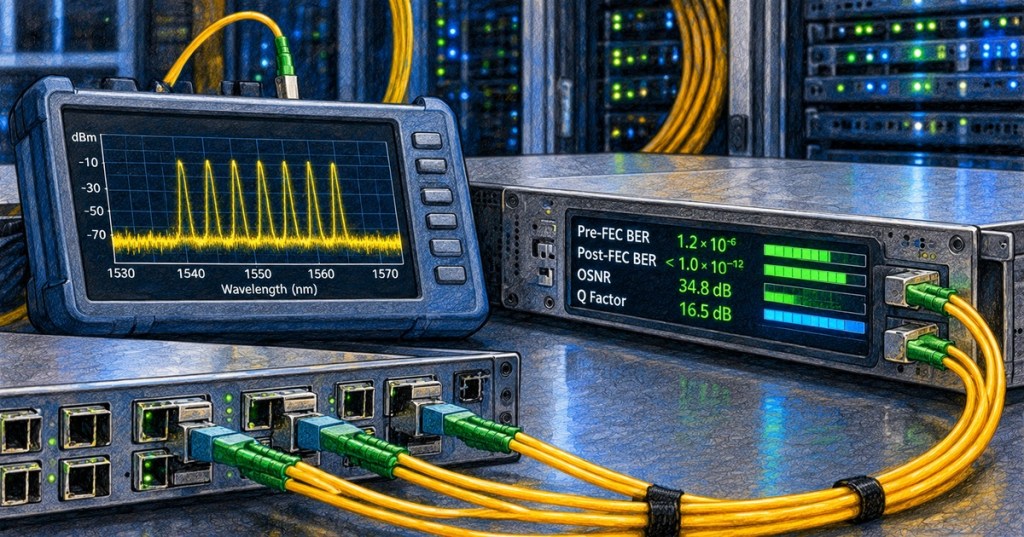
Optical performance monitoring turns a live fiber link into a measurable engineering system. Instead of waiting for traffic to fail, engineers track power, OSNR, pre-FEC BER, post-FEC BER, Q-factor, chromatic dispersion, polarization effects, coherent-DSP estimates, and long-term trends to understand how much operating margin remains.
This lesson follows OSFOEC.009: Optical Network Protection and Restoration. Protection can move traffic around a failure; performance monitoring helps determine whether the working path, protection path, and restored path are actually healthy enough to carry service with acceptable margin.
Ciena provides a concise introduction to coherent optical technology and the receiver architecture that makes many modern performance measurements possible.
Elementary Overview
An optical network does not suddenly change from “good” to “bad.” Its quality normally moves along a spectrum. A connector gets dirtier, amplifier noise increases, a channel loses power, dispersion changes, or the error rate rises. Performance monitoring is the practice of measuring those changes early enough to diagnose them before they become outages.
Learning Objectives
- Distinguish optical power, OSNR, Q-factor, pre-FEC BER, and post-FEC BER.
- Explain why coherent DSP can act as a performance monitor.
- Interpret CD, DGD/PMD, frequency-offset, and receiver-quality telemetry.
- Separate instantaneous alarms from long-term margin trends.
- Use correlated measurements to isolate likely fault domains.
- Design threshold and telemetry strategies without creating alarm noise.
- Build a commissioning baseline for future comparison.
- Explain why multi-vendor optical telemetry requires metric consistency and context.
Monitoring Starts With Optical Power
Transmit and receive optical power are basic health indicators. A falling receive-power trend can point toward added connector loss, fiber attenuation, bending, splice degradation, amplifier gain change, ROADM filtering, or a transmitter problem. Power alone cannot describe signal quality, but it establishes whether enough optical energy is arriving at the receiver.
Engineers should record both absolute value and trend. A channel sitting at −8 dBm may be healthy if that is normal for the design, while a channel that moved from −3 dBm to −8 dBm in two days may deserve immediate investigation even though it remains inside a broad vendor limit.
OSNR Measures Signal Against Optical Noise
Optical signal-to-noise ratio compares signal power with optical noise power in a defined reference bandwidth. In amplified DWDM systems, amplifier spontaneous-emission noise accumulates across spans. A receiver can therefore have adequate total optical power while the useful signal is buried in enough noise to reduce margin.
VIAVI Solutions demonstrates how OSNR is generated and measured in optical test equipment, reinforcing why optical power alone does not describe signal quality.
Modern coherent systems complicate traditional out-of-band OSNR measurements because wide modulated signals, dense channel spacing, ROADMs, filtering, and polarization-multiplexed formats can make simple interpolation inaccurate. EXFO therefore distinguishes traditional spectral measurements from in-band and Pol-Mux OSNR techniques intended for coherent systems.
Pre-FEC BER Is an Operating-Margin Sensor
Pre-FEC BER is the raw bit-error rate measured before forward error correction repairs the data. It is often one of the most useful real-time indicators of coherent-link health because it reflects the combined result of noise, distortion, nonlinear penalties, filtering, phase errors, and receiver impairment.
Post-FEC BER is measured after correction. A link can show essentially zero post-FEC errors while pre-FEC BER is steadily worsening. That does not mean the link is equally healthy; it means the FEC still has enough coding gain to hide the impairment. Engineers therefore watch the distance between current pre-FEC performance and the decoder’s failure threshold as a form of margin.
Ciena explains how modern soft-decision FEC and coherent DSP extend usable reach and why pre-FEC behavior is central to optical performance margin.
Q-Factor Converts Error Performance Into a Useful Quality Metric
Optical systems often report a Q-factor or Q-related margin derived from receiver statistics or BER. The exact definition depends on platform and modulation format, so an engineer should not compare raw Q values across unrelated vendors without understanding how each system computes them.
The useful engineering practice is to establish a known-good baseline and track deviation. A stable channel with 3 dB of measured margin and a channel whose margin fell from 7 dB to 3 dB may report the same current state, but the second channel carries much stronger evidence of an emerging fault.
The Coherent DSP Is Also a Sensor
A coherent receiver must estimate and correct physical impairments in order to recover data. Those adaptive algorithms naturally expose useful telemetry. Depending on platform, a transceiver may report chromatic dispersion, differential group delay, second-order PMD, carrier-frequency offset, received power, estimated SNR, polarization behavior, FEC counters, equalizer state, and other DSP-derived measurements.
Ciena’s WaveLogic overview shows how coherent optical processors combine high-speed conversion, DSP, modulation, and receiver intelligence inside the transport system.
Cisco’s 400G coherent-optics documentation exposes performance-monitoring parameters including transmit and receive power, chromatic dispersion, differential group delay, second-order PMD, pre-FEC BER, post-FEC BER, error-corrected bits, and uncorrected words. These counters turn the optical module into a continuous diagnostic source rather than a simple up/down interface.
Chromatic Dispersion Is More Than a Design-Time Number
Chromatic dispersion causes different frequency components of a pulse to travel at different group velocities. Coherent DSP can digitally compensate substantial CD, but the estimated compensation value remains useful telemetry. If the measured CD is radically different from the expected route length or changes after a restoration event, the service may be traveling a different path than intended.
That makes CD telemetry useful not only for signal quality but for topology validation. A restored wavelength that suddenly reports an additional several thousand ps/nm of dispersion may have been routed across a materially longer fiber path, which can change nonlinear and OSNR margin even if traffic remains up.
PMD and DGD Are Dynamic
Polarization-mode dispersion results from different polarization states experiencing different propagation delays. Differential group delay can vary with temperature, vibration, mechanical stress, and fiber condition. Modern coherent equalizers track these changes continuously.
A slowly varying DGD trace is normal. A sudden, persistent change correlated with maintenance, rerouting, or a physical event can help identify when the optical path changed. A receiver approaching its PMD-tracking limit may show increasing BER or Q penalty even while average optical power looks normal.
Cycle Slips Reveal Phase-Recovery Stress
Coherent receivers estimate carrier phase digitally. Under severe phase noise or difficult operating conditions, the estimator can occasionally lose the correct phase trajectory and jump by a symbol-related phase increment. These cycle slips can create bursts of bit errors that may be corrected by FEC or may leak into client traffic if severe enough.
Ciena explains coherent cycle slips and how phase-recovery behavior can translate into bursts of bit errors and service penalties.
Correlate Metrics Instead of Reading One Counter
- Receive power falls, OSNR stays similar: suspect added attenuation after the dominant noise sources, connector loss, fiber bend, or local insertion loss.
- Power stays stable, OSNR falls: suspect amplifier noise, gain imbalance, excess ASE, channel loading changes, or spectral contamination.
- OSNR is stable, pre-FEC BER worsens: investigate filtering, nonlinear impairment, laser/phase behavior, polarization effects, DSP stress, or hardware degradation.
- Pre-FEC BER worsens but post-FEC remains clean: the service is still passing, but operating margin is being consumed.
- CD changes abruptly: verify route restoration, wavelength path, patching, or transponder configuration.
- DGD/PMD changes abruptly: correlate with path changes, fiber handling, environmental events, or a different protection route.
- One wavelength degrades while neighbors remain stable: suspect channel-specific optics, filtering, frequency alignment, or transponder issues.
- Many wavelengths degrade together: suspect shared amplifiers, ROADM nodes, fiber spans, power equalization, or common infrastructure.
Trend Data Is More Powerful Than a Single Snapshot
Threshold alarms answer, “Has this value crossed a line?” Time-series telemetry answers, “Where is this value going?” Both are necessary. A network may never cross an alarm threshold yet still show a clear six-month erosion in Q-margin, rising corrected-bit counts, or declining receive power.
Useful telemetry systems retain enough history to compare seconds, minutes, hours, days, and maintenance epochs. They also preserve configuration and topology context so engineers can distinguish a real impairment from a planned route or modulation change.
Telemetry Becomes More Valuable When It Is Automated
Modern optical operations increasingly export performance data through management APIs and streaming telemetry rather than relying only on technicians reading local displays. The engineering goal is not to collect every possible counter. It is to collect the measurements that can answer operational questions such as: Which channels are losing margin? Which spans create the largest penalty? Did a restoration path change optical quality? Which interfaces show correlated degradation?
An optical-networking automation discussion highlights the practical interest in NETCONF, gNMI, TAPI, telemetry, and multi-vendor operational tooling for DWDM and OTN environments.
Build a Commissioning Baseline
- Record route, span length, wavelength/frequency, baud rate, modulation, FEC mode, and expected reach.
- Capture transmit power and receive power at both ends.
- Measure or record OSNR using an appropriate method for the modulation and line system.
- Record pre-FEC BER, post-FEC BER, Q/Q-margin, corrected-bit counts, and uncorrected-word counters.
- Record coherent-DSP estimates such as CD, DGD/PMD, and frequency offset where available.
- Capture amplifier gain, ROADM attenuation/equalization, and channel-power profile.
- Run continuous traffic long enough to observe thermal and polarization variation.
- Save the baseline with software version, configuration, physical route, and timestamp.
- Repeat the capture after protection switching and restoration tests.
- Define alert thresholds from design margin and observed variability rather than arbitrary round numbers.
Thresholds Need Hysteresis and Persistence
A noisy metric can cross a threshold repeatedly and create alarm storms. Good monitoring logic often uses persistence, averaging, hysteresis, or multiple severity levels. A brief Q dip might generate a warning only if it persists for several intervals, while an uncorrected-word event may trigger immediate escalation.
Thresholds should also reflect service class. A long-haul channel operating near its engineered limit may have less spare margin than a metro link. The same absolute BER or Q value can therefore mean different risk depending on the system design, FEC mode, modulation, and expected variability.
Multi-Vendor Metrics Need Normalization
Two coherent modems may expose similarly named values that are calculated differently. OSNR may be measured optically or estimated digitally; Q may use different statistical conventions; BER may be averaged over different windows; and “margin” may be referenced to different FEC thresholds.
For multi-vendor operations, store metric definition, units, sample interval, reference bandwidth, averaging method, FEC mode, and vendor interpretation with the number itself. Normalization without metadata can create false comparisons.
Engineering Exercise
A 400G coherent wavelength normally operates at −5 dBm receive power, 22 dB measured OSNR, pre-FEC BER of 8 × 10⁻⁴, and 5 dB reported margin. Over four weeks, receive power remains between −5.0 and −5.2 dBm while OSNR falls to 19 dB, pre-FEC BER rises to 2.5 × 10⁻³, and reported margin falls to 1.8 dB. Neighboring channels on the same amplified span show a similar OSNR decline.
Identify the most likely shared fault domain and explain why connector loss at a single transponder is less likely. List the amplifier, channel-loading, ROADM, and spectrum measurements you would collect next. Then define a warning threshold and a critical threshold using trend plus absolute performance rather than a single counter.
Knowledge Check
- Why can receive power look healthy while a coherent channel has poor margin?
- What is the difference between pre-FEC and post-FEC BER?
- Why is pre-FEC BER often useful before an outage occurs?
- What optical impairment does OSNR quantify?
- Why can coherent DSP report chromatic dispersion and PMD?
- What might an abrupt CD change indicate operationally?
- Why are time-series trends more useful than a single threshold alarm?
- Why should Q or OSNR values not always be compared directly across vendors?
- What does a worsening pre-FEC BER with clean post-FEC BER mean?
- Why should baseline telemetry be captured after a protection-path switch?
Answers
- Total optical power can remain adequate while amplifier noise, filtering, nonlinear distortion, or other impairments reduce signal quality.
- Pre-FEC BER measures errors before correction; post-FEC BER measures residual errors after the FEC decoder attempts to repair them.
- It can rise as link margin is consumed even while FEC still prevents client-visible errors.
- The ratio of useful optical signal power to optical noise power in a defined reference bandwidth.
- The coherent receiver already estimates and compensates those impairments to recover the transmitted symbols, so the DSP can expose its estimates as telemetry.
- A route change, restored path, patching change, or materially different fiber length.
- Trends show direction and rate of degradation before a hard limit is crossed.
- Vendors may calculate the metric differently, use different averaging windows, reference bandwidths, FEC thresholds, or DSP estimators.
- The link is still operational, but the FEC is consuming more coding margin and the service is closer to its failure threshold.
- The protection path can have different loss, OSNR, dispersion, amplifier loading, and nonlinear margin than the normal working path.
Elementary Conclusion
The simplest way to think about optical monitoring is: power tells how much light arrived, OSNR tells how clean that light is, BER tells how accurately the receiver is decoding it, and DSP telemetry helps explain why. The best engineering decisions come from watching those measurements together over time instead of treating any single number as the truth.
Previous Related Lessons
- OSFOEC.009: Optical Network Protection and Restoration
- OSFOEC.008: ROADM and Optical Line Systems
- OSFOEC.007: Coherent Optical Transmission Engineering
- OSFOEC.006: Optical Amplification Engineering
Primary References
- Cisco — Configuring 400G Digital Coherent Optics
- EXFO — Spectral Testing and OSNR
- EXFO — Optical Spectrum Analyzer
- Optica — Optical Performance Monitoring in DSP-Based Coherent Optical Systems
- Optica — Digital Coherent Receiver Based Optical Performance Monitoring
- Ciena — Real-Time Photonic Performance Monitoring and Automation
BitcoinVersus.Tech Editor’s Note:
We volunteer daily to ensure the credibility of the information on this platform is Verifiably True. If you would like to support to help further secure the integrity of our research initiatives, please donate using the QR code provided

For best QR-code scanning results, please scan this donation code from a desktop or larger screen. Mobile screens may prevent camera recognition.
BitcoinVersus.Tech provides technical education and analysis for informational purposes only.


Leave a Reply