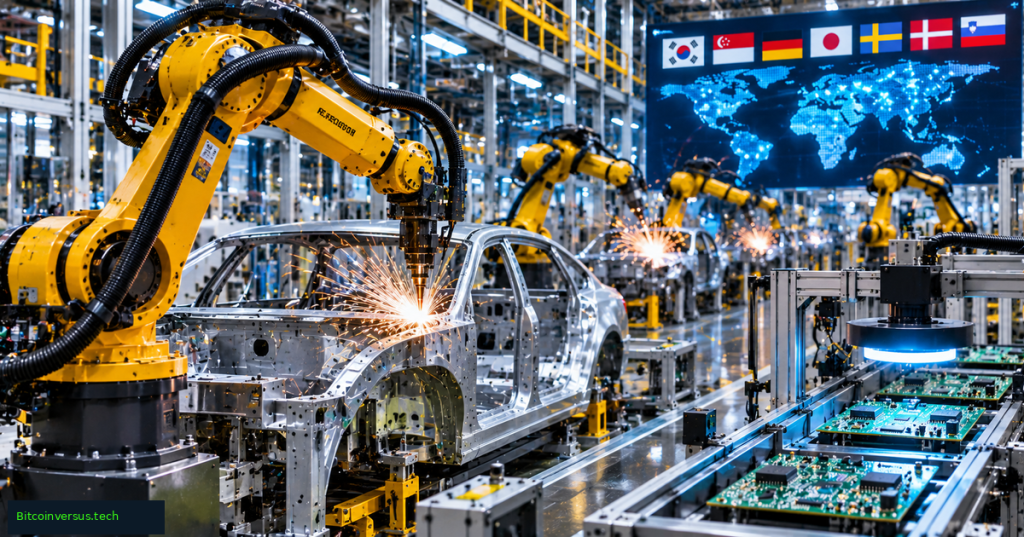
Industrial robots weld vehicle bodies, move heavy components, assemble electronics and inspect finished parts. Their worldwide operational stock exceeded five million units in 2025, according to the International Federation of Robotics (IFR), whose September 24, 2026, report documented 603,307 newly installed machines. But total installations alone do not show which countries rely most heavily on factory automation. A more comparable measure is robot density: operational industrial robots per 10,000 manufacturing employees.
International Federation of Robotics, “World Robotics 2026” facts video, shared by IFR with its report. The official video describes worldwide deployments, not an independently measured robot-density experiment.
The Seven Most Robot-Dense Manufacturing Economies
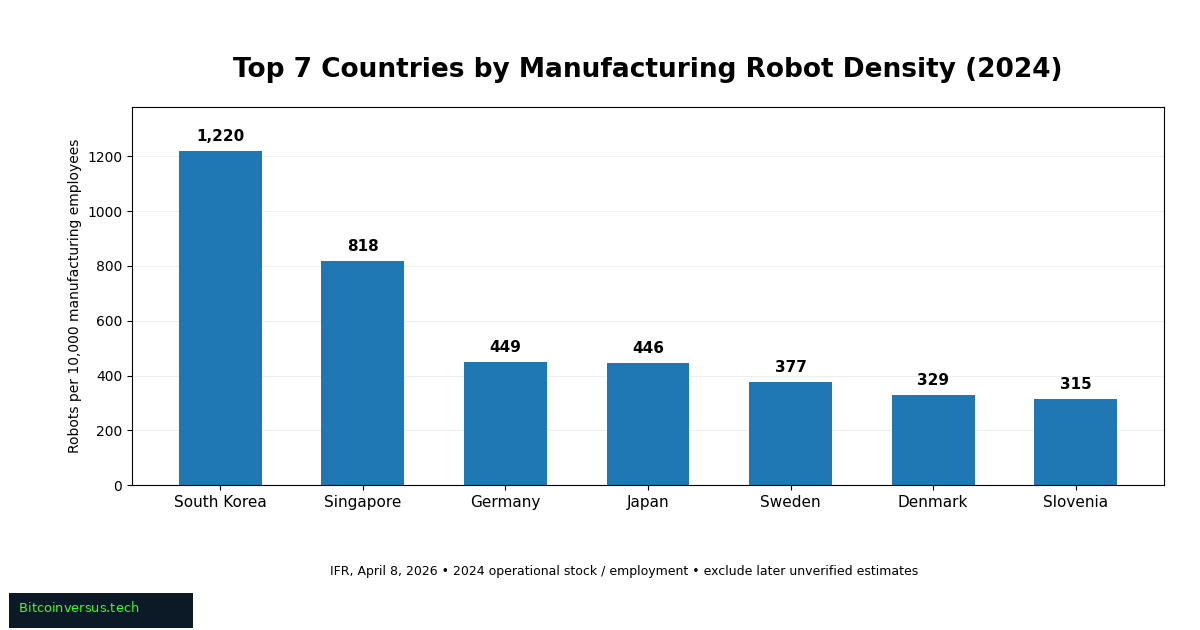
The following ranking uses IFR’s April 8, 2026, country release covering 2024, the latest fully sourced public IFR density table independently checked for the comparison. The newly released World Robotics 2026 report covers 2025 robot installations and stock; those later totals must not be inserted into an older employee-normalized ranking. Countries are ordered by robots operating per 10,000 manufacturing employees, not by robot shipments or population.
1. South Korea — 1,220 robots. Electronics and automotive manufacturers underpin the highest reported robot density. South Korea’s density is roughly 1.49 times Singapore’s and more than nine times the IFR’s revised global 2024 average of 132.
2. Singapore — 818 robots. The city-state has far fewer manufacturing workers than large industrial economies, allowing its relatively modest installed base to generate a high density. IFR reported average annual growth of approximately 13% since 2019.
3. Germany — 449 robots. Europe’s largest industrial economy leads the region by density. Car manufacturing is a major source of robot demand, although IFR’s latest 2025 installation release recorded declining German purchases.
4. Japan — 446 robots. The country is both a major robot manufacturer and user. Its 2024 density sits just three units below Germany’s, too small a margin to infer meaningful differences in factory productivity.
5. Sweden — 377 robots. A manufacturing base covering vehicles, machinery and industrial equipment supports high automation density relative to workforce size.
6. Denmark — 329 robots. Industrial adoption extends through specialized manufacturing, where smaller production teams use robotic handling, machining and packaging.
7. Slovenia — 315 robots. The country’s strong manufacturing automation keeps it in the global top seven. The United States followed at 307 robots per 10,000 manufacturing employees, according to the same IFR list.
Why China Leads Installations but Not Density
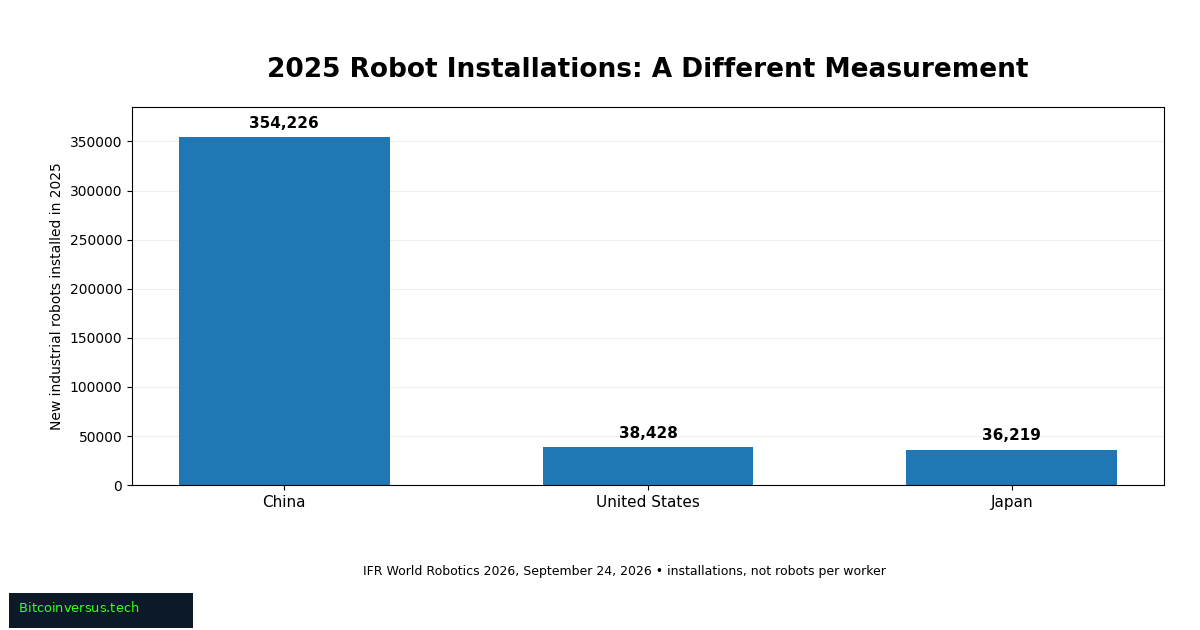
In the September 2026 report, China installed 354,226 robots in 2025, while the United States installed 38,428 and Japan 36,219. The numbers indicate annual additions, not factories’ automation intensity. The same report places global operational stock at 5,079,078 units. Earlier BitcoinVersus.Tech reporting covered the five-million-robot milestone and the implications of long-term automation for employment.
International Federation of Robotics, World Robotics 2026 Industrial Robots press-conference recording, linked from IFR’s official September 2026 release. Speakers discuss market statistics and manufacturing demand; the conference is not a 2024 density-specific field test.
What the Ranking Does and Does Not Measure
Robot density normalizes for manufacturing workforce size, but it does not reveal how many factories have robots, how effectively machines operate, or whether jobs are being replaced. A single heavily automated automotive plant can influence the national ratio. Industrial robotic arms also differ from newer service robots and pilot-stage humanoids. The site’s humanoid deployment ranking and warehouse-robot survey cover different classes of systems.
The IFR revised some manufacturing employment denominators, particularly China’s, changing previously published density comparisons. China’s 2024 figure is 166 in the revised April 2026 release, despite its enormous robot fleet. Policy decisions should consider output, wages, reliability, safety and capital cost alongside robot counts. A recent warehouse automation investment illustrates why installation announcements must be separated from actual deployed inventory.
Primary sources: IFR robot-density release, April 8, 2026; IFR World Robotics 2026 announcement, September 24; IFR World Robotics 2026 executive summary. Figures are not forecasts unless identified.
BitcoinVersus.Tech Editor’s Note
Published November 8, 2026. Country ranks and densities refer to 2024, published by IFR April 8, 2026, using updated workforce denominators. The September 24, 2026, report supplies newer global totals and 2025 installation statistics, a different metric. The featured cover is conceptual artwork, not a photograph of a named factory. Both original charts depict separate, clearly labeled datasets. IFR videos provide manufacturer-industry context; their presence alone does not certify actual playback.
We volunteer daily to ensure the information on this platform is Verifiably True. If you would like to support the research, please scan QR code.

Support independent research with an optional donation of 5,000 satoshis. Scan the original QR using a Bitcoin wallet on another screen or a compatible saved-image scanner on mobile. Verify destination 3C9o19EH5HSiwEPyCTmEKzxhNCbo2X6TTb and amount before sending.
BitcoinVersus.Tech is not a financial advisor. Financial coverage is provided purely for informational purposes.


Leave a Reply