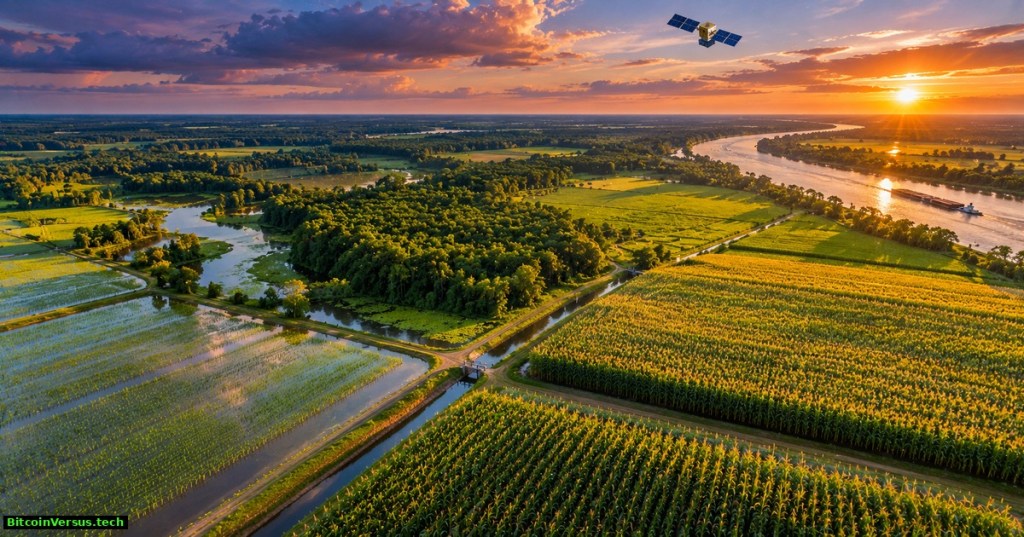
NASA researchers have shown how satellites can estimate water lost from individual farm fields, revealing patterns that conventional regional averages can hide. A NASA report published November 19, 2026 describes maps of the Lower Mississippi Alluvial Plain, a major agricultural region where irrigation and groundwater supplies are increasingly important.
Using the open-source OpenET platform, Cornell University and NASA collaborators examined 2016–2022 water-use estimates for soybeans, corn, cotton, rice and nearby forests. A separate NASA illustration from July 2026 shows how sharply estimates differ between neighboring fields around Rayne and Crowley, Louisiana. The research is about water transferred to the air, not direct measurement of irrigation pipes or aquifer withdrawals.
NASA Goddard’s August 6, 2026 video, “Vine by Vine,” explains Landsat thermal measurements and the OpenET water-use platform. The California vineyard example predates and is geographically separate from the new Mississippi Plain study.
How NASA measures a farm’s thirst
The key measurement is evapotranspiration, or ET. Water evaporates from soil and is released through plant leaves during transpiration. Landsat surface-temperature observations, weather measurements and multiple computer models help OpenET estimate the combined water loss. Its maps have 30-meter spatial resolution, meaning one map pixel covers approximately 900 square meters, or 0.22 acre.
That level of detail can distinguish irrigated fields from nearby non-irrigated land and follow changing conditions within a growing season. The maps estimate total water leaving a surface, including rain-supplied water; ET is not equivalent to groundwater pumped or irrigation water applied. Those quantities require additional accounting and, ideally, local observations.
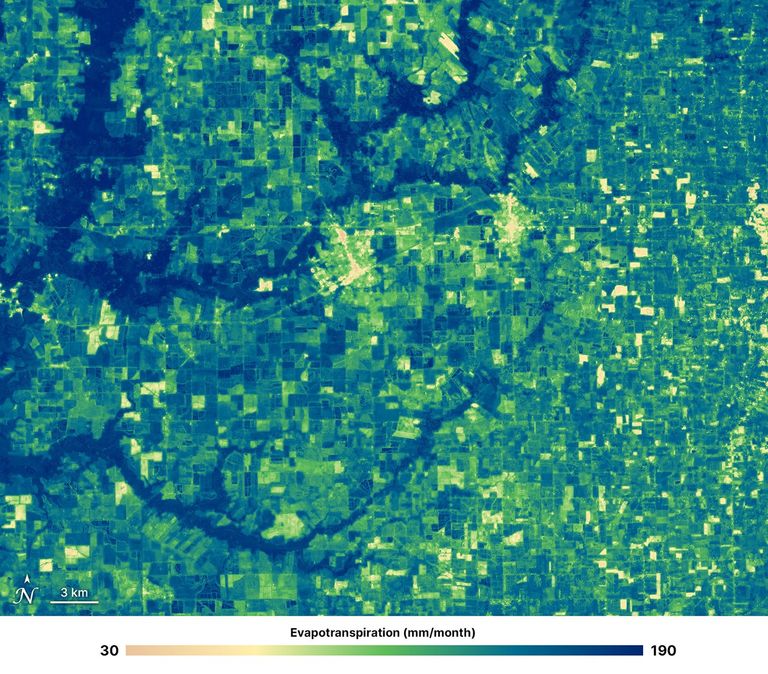
NASA’s July example uses a color scale from approximately 30 millimeters per month in some developed or fallow areas to 160 millimeters in irrigated cropland, with some bayou areas near 190 millimeters. The figures are local mapped estimates, not crop averages, and the July 2026 image is not part of the 2016–2022 analysis window.
Why forests responded differently to drought
Across the seven-year research period, both managed crops and forests generally reached peak water loss in July. Forest ET was higher overall and changed less during drought, while crop stress indicators reacted faster. Deep roots may help some forests access water when surface soils become dry, though species, soil and landscape differences complicate broad comparisons.
One result deserves particular attention: crop water loss remained comparatively stable during some dry periods while modeled groundwater storage declined. The pattern is consistent with irrigation helping maintain crop growth, but does not by itself prove the amount of water extracted from underground aquifers. Independent pumping data and water-level records remain important.
NASA Video’s archival “Landsat: A Space Age Water Gauge” explains how thermal satellite observations support ET estimates. Included as technical background, not as footage of the 2026 research project.
Where the technology could be useful
Farmers can compare expected crop demand with rainfall, monitor changing field conditions and adjust irrigation plans. Water authorities could use maps to identify areas where water-use estimates warrant closer investigation. OpenET has already supported water-management programs outside the Mississippi Basin, including western U.S. water accounting, although the new paper does not evaluate statewide conservation results.
Related BitcoinVersus.Tech reporting examined NASA’s 3D forest wildfire mapping and Planet Labs’ daily Earth imagery. Those are distinct satellite uses. Other water-focused technologies include electrified cloth for recovering phosphate from water and waste-heat-powered water treatment concepts. Water measurement, pollution cleanup and water production address different problems.
Limits before farms rely on the maps
Clouds, weather-input errors, model assumptions, changing crops and local irrigation practices can reduce accuracy. A 30-meter estimate is detailed but not a direct sensor reading from every plant. The researchers’ broad conclusion is that field-scale satellite observations can improve understanding of water demand and drought response; claims of specific savings require measured outcomes after farmers change operations.
The larger achievement is visibility. By mapping water loss at a field scale over multiple seasons, OpenET can make irrigation planning and groundwater stewardship more evidence-driven, provided operators treat satellite estimates as one layer of a larger water budget.
Primary research and original media
- NASA Landsat, November 19, 2026, Satellites Reveal the Thirst of Fields and Forests
- Duan et al., Field-scale water use assessment in the Lower Mississippi Alluvial Plain using OpenET, International Journal of Applied Earth Observation and Geoinformation, 2026
- OpenET, open data and evapotranspiration methods
- NASA/USGS Landsat mission science and thermal measurements
- NASA Goddard, August 6, 2026, Vine by Vine: Conserving Water With Landsat
Editor’s Note: We volunteer daily to ensure the credibility of the information on our platform is Verifiably True. If you would like to support our work and the integrity of our research initiatives, scan the QR code below to donate 5,000 sats.
For mobile scanning, open the article on another display and scan the QR code using a Bitcoin wallet. Verify the receiving address 3C9o19EH5HSiwEPyCTmEKzxhNCbo2X6TTb before sending.
BitcoinVersus.Tech publishes science, technology and engineering journalism for informational purposes. It does not provide financial, legal, agricultural or professional engineering advice.


Leave a Reply