
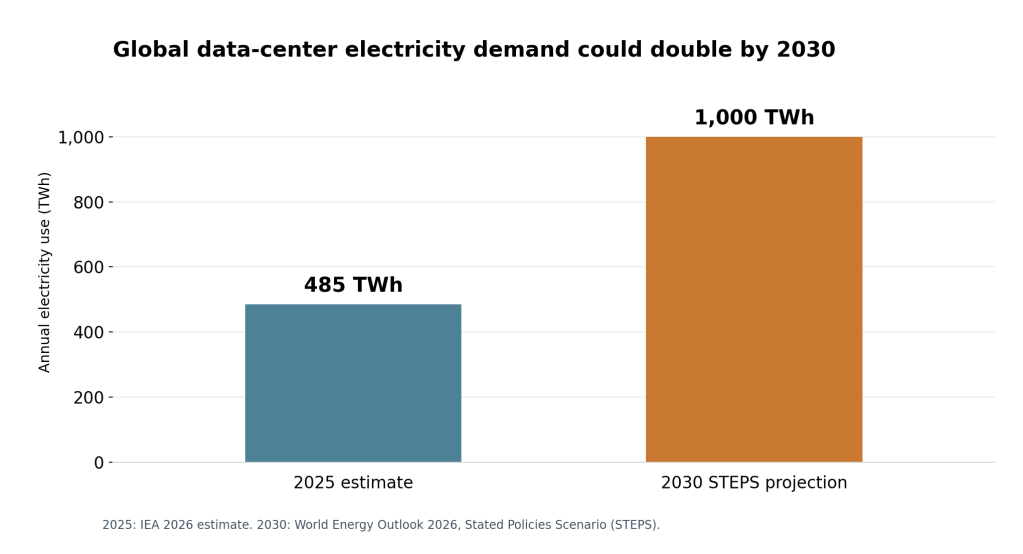
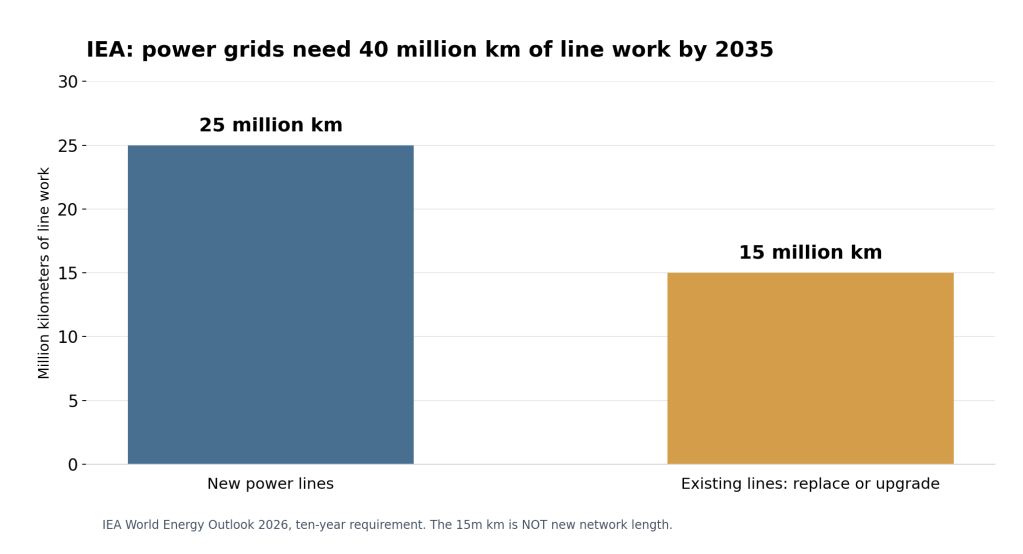
Data-center builders face a different schedule from electric utilities: AI servers can arrive within months, but substations and transmission projects take years. The International Energy Agency’s World Energy Outlook 2026, published November 19, projects 1,000 terawatt-hours (TWh) of annual data-center electricity use by 2030 under its Stated Policies Scenario (STEPS). The same outlook identifies 40 million kilometers of new and renewed power-line work needed worldwide over ten years. The figures describe distinct demands on one interconnected electricity system.
Official International Energy Agency documentary, August 2026: satellite mapping of AI data centers and the energy systems supporting them. Background video recorded before the November outlook. Watch the IEA documentary on YouTube.
How data-center demand could double
An earlier IEA study estimates worldwide data-center electricity consumption at 485 TWh in 2025. Compared with the new 1,000 TWh forecast, the modeled increase is 515 TWh annually, or approximately 106%. The implied compound growth rate is around 15.6% per year across five years. Crucially, the 2025 figure is an estimate of consumption already incurred; the 2030 value is a model output, not verified future electricity demand.
The November IEA report says data-center use grew 17% during 2025. Its modeling attributes approximately three-quarters of the increase through 2030 to AI-optimized facilities, with conventional cloud, storage and streaming facilities making up the remainder. Shipments of computing servers inform the analysis; proposed data-center megawatts are not automatically counted as operational equipment.
A 40-million-kilometer grid challenge
The physical grid requirement breaks into two activities. The IEA calls for at least 25 million kilometers of new power lines and 15 million kilometers of existing lines requiring upgrades or replacement over roughly a decade. Together they represent 40 million kilometers of line work, not 40 million kilometers of net-new grid length. Dividing by ten gives an illustrative average of four million kilometers of work per year, although actual schedules and costs will vary by region.
Industrial electrification, transport, cooling and households also contribute to the requirement. Deliverable electricity depends on geographic transmission paths, substations, transformers, breakers and protection systems. Generation installed far from a computing campus cannot always serve it without additional grid equipment or flexible operating agreements.
CNBC’s July 2024 investigation documents data-center cooling, electrical delivery and grid pressure. Historical engineering background, not a report about the IEA’s November 2026 figures. Watch the original CNBC video on YouTube.
Investment grows faster than grid construction
The IEA reports $565 billion in global data-center investment in 2025 and anticipates approximately $4 trillion of additional associated investment by 2030. Separately, its equipment analysis suggests the global stock of accelerated AI servers has grown about 18-fold since 2020. Historical capital spending, prospective investment and server installations are different measurements. None establishes how much electricity a specific planned campus can presently import.
Examples in the BitcoinVersus.Tech archive illustrate the hardware challenge: Vertiv’s 5 MW data-hall converter, a proposed 432-GPU compute pod, an AI hall on a Bitcoin-mining property, and a separate U.S. data-center electricity forecast. Design drawings, equipment deliveries, commissioned rack power and actual utilization demand different forms of evidence.
What could move the numbers
IEA scenarios depend on policies, economic growth, computing demand, chip efficiency and the ability to connect projects. Delayed grid upgrades, semiconductor supply constraints, cooling capacity, higher power prices or more efficient AI models could alter realized TWh. Improvements in energy per calculation can coincide with higher aggregate power draw when more computations are performed. Future scorecards should compare estimated consumption with metered results and independently confirmed energized capacity.
Primary documentation: World Energy Outlook 2026 highlights; IEA executive summary and grid figures; full IEA outlook, section on AI investment; IEA 2025 data-center consumption estimate. Derived growth percentages are calculations from rounded published figures.
We volunteer daily to ensure the credibility of the information on this platform is Verifiably True. If you would like to support to help further secure the integrity of our research initiative, please scan the QR code below.



Leave a Reply