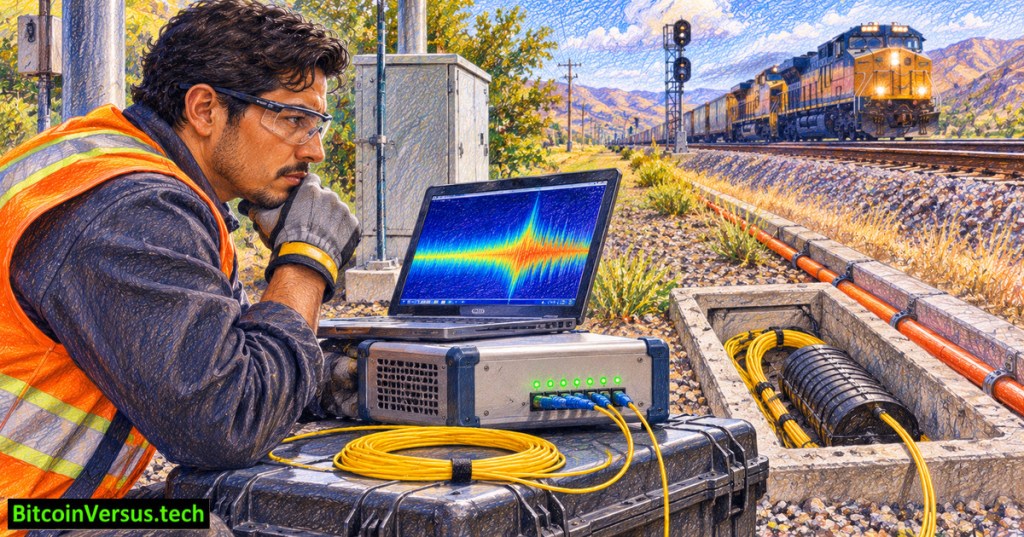
OSFOEC.017 explores a surprising use for ordinary optical fiber: detecting vibrations along a cable without installing thousands of conventional microphones. Distributed acoustic sensing (DAS) repeatedly sends coherent laser pulses into suitable fiber and analyzes returning light. It can indicate where disturbances occur along railways, pipelines, or seismic research lines. DAS measures fiber deformation rather than recording sound exactly as a microphone does. The lesson follows OSFOEC.016 on fiber Bragg gratings.
Key Learning Objectives
By the end of OSFOEC.017, learners should be able to:
- Define Rayleigh backscatter, interrogator, gauge length, and strain rate.
- Explain how pulse timing locates a disturbance and phase changes indicate deformation.
- Distinguish DAS from temperature sensing and point-like fiber Bragg grating sensors.
- Identify measurement uncertainty, false alarms, and safe commissioning boundaries.
Prerequisites
Recommended preparation: basic fiber propagation, decibels, and the OSFOTC.003 introduction to optical time-domain reflectometry (OTDR).
Core definitions: Rayleigh backscatter, interrogator, gauge length, and strain rate
Rayleigh scattering is the weak, nearly elastic scattering of light by tiny, naturally occurring fluctuations in the optical properties of glass. Most laser light continues down the fiber. A small fraction scatters backward toward the launching end, called Rayleigh backscatter. The returning light comes from many microscopic scattering sites along the fiber, not from discrete connectors or microphones. A coherent DAS system examines changes in the backscattered optical signal to sense physical deformation. See the ETH Zurich DAS explanation.
An interrogator is the optoelectronic instrument at one end of the sensing fiber. It generates precisely timed, coherent laser pulses; receives weak backscattered light; converts the optical returns into electronic measurements; and processes timing and phase to estimate the disturbance location and dynamic strain. The interrogator is the active measuring device; passive glass cable alone does not produce an alert.
Strain, written ε, is the fractional change in length: ε = ΔL/L. Stretching a 10-meter segment by 0.1 millimeter produces 0.00001 strain, equivalent to 10 microstrain (µε). Strain rate, written dε/dt, describes how quickly strain changes, commonly expressed as microstrain per second (µε/s). If the illustrative 10 µε increase occurs evenly over 0.5 seconds, the average strain rate is 20 µε/s. Real DAS instruments can provide phase, strain, or strain-rate outputs depending on processing and calibration; strain rate is not the same physical quantity as microphone sound pressure.
Gauge length is the fiber section used to estimate one differential phase or average axial strain measurement. A reported value represents behavior over a finite span, rather than a measurement at a mathematical point. Channel spacing is the step between neighboring reported positions. When spacing is shorter than gauge length, neighboring readings overlap spatially and cannot be treated as independent sensors. The Nature Communications research on distributed fiber sensing explains the distinction.
How a fiber becomes a long sensor
Tiny variations in the fiber’s refractive index scatter a small fraction of laser light back toward the instrument. In phase-sensitive OTDR, a stable laser interrogator compares the coherent return from different locations and times. Mechanical strain changes the optical path length, affecting the phase of the returned light. ETH Zurich’s fiber-sensing laboratory explains the pulsed-light and Rayleigh-backscatter mechanism.
Distance comes from two-way travel time. Light travels down the fiber to the disturbance region and back. In a simplified model, distance equals the fiber’s propagation speed multiplied by elapsed round-trip time, divided by two. Real systems use calibrated propagation and timing parameters. Optical loss, pulse settings, and the sensing fiber’s installation affect available range and signal quality.
The mechanism: pulse timing locates the signal; optical phase reveals deformation
Step 1 — location by timing: the interrogator sends a short pulse into the fiber. Backscatter from nearby locations returns first; light from more distant locations takes longer. For measured round-trip delay Δt, an illustrative distance estimate is z = c × Δt /(2ng), where c is vacuum light speed and ng is the fiber’s group refractive index. With a 10-microsecond delay and assumed ng = 1.468, the estimate is approximately 1.02 kilometers along the fiber. The factor of two accounts for the outward and return paths. A buried cable’s path distance is not necessarily the same as a straight-line map distance.
Step 2 — deformation by phase: microscopic scatterers create a coherent optical return whose phase depends on optical path length and refractive index. Compression or stretching changes that optical path. Comparing phase at two positions separated by the gauge length, and then comparing measurements across time, reveals dynamic axial strain or strain rate after calibration. Phase measurements may suffer fading, wrapping, and noise; a color change on the dashboard is not automatically a calibrated force or acoustic pressure reading.
Step 3 — location-resolved history: the instrument repeats pulse-and-measure cycles, building a time series for each location. The output may appear as a distance-versus-time display. The measured quantity, pulse settings, sampling rate, calibration factors, and filtering algorithm must be known before assigning physical meaning to the displayed values. Read the Journal of the Acoustical Society of America review for a detailed account of the signal chain.
Why gauge length matters
A gauge length is the section of fiber over which the instrument estimates an average axial strain or strain change. Channel spacing is the distance between successive reported sample positions. They are not interchangeable. For example, a hypothetical system reporting channels every 1 meter with a 10-meter gauge length would produce overlapping measurements; the 1-meter spacing does not imply ten independent 1-meter vibration sensors. The Annual Review of Earth and Planetary Sciences discusses gauge length, coupling, and direction-dependent responses.
Fiber usually responds most directly to deformation along its length. A passing train can produce a detectable signal when vibration couples from the track and ground into the cable, but cable burial, orientation, slack, and local soil conditions alter the response. A strong waveform does not, by itself, identify a train, leak, earthquake, or excavator.
How DAS differs from DTS, distributed strain sensing, and fiber Bragg gratings
The technologies share optical fibers but have different measurement goals and optical signatures. The appropriate system depends on the physical quantity of interest, response speed, installation design, and required accuracy.
| Technology | What it measures | How the signal is produced |
|---|---|---|
| DAS | Changing axial strain or strain rate caused by vibration and other disturbances along many locations | Typically coherent Rayleigh backscatter and phase-sensitive reflectometry |
| DTS | Temperature as a function of distance | Commonly temperature-dependent Raman backscatter; some systems use other methods |
| Brillouin distributed sensing | Strain and temperature along a fiber, often emphasizing slower changes | Frequency shifts in Brillouin scattering with compensation or independent information |
| FBG | Strain or temperature at installed grating locations | Shifts in the narrow reflected wavelength of a deliberately written fiber Bragg grating |
DAS does not automatically reveal the temperature of every location. DTS is not a substitute for vibration-event characterization. An FBG is an identifiable sensing element rather than a continuous record of every section between gratings. Review OSFOEC.014 on Raman temperature sensing and OSFOEC.015 on Brillouin sensing; see also the Fiber Optic Sensing Association glossary.
Reading a DAS record
A common visualization places distance along the cable on one axis, time on another, and measurement amplitude or another processed feature in color. A moving vibration source may create a diagonal pattern; a stationary repeated disturbance may appear at a consistent distance. Reliable classification requires labeled reference events and calibrated thresholds. The VIAVI sensing overview distinguishes phase-based quantitative DAS from less directly calibrated intensity-based approaches.
Measurement uncertainty, false alarms, and what DAS cannot prove
- Coupling and geometry: loose cable, conduits, soil conditions, and the angle of a vibration relative to the fiber can weaken or alter the measured signal. Quiet output need not mean no disturbance occurred.
- Noise, attenuation, and fading: optical loss, coherent interference effects, and electronic noise can reduce sensitivity or create gaps. A weak distant event can be missed even when a nearby event is clear.
- Distance uncertainty: approximate group index, unrecorded cable slack, uncertain route maps, and splice locations can shift the inferred geographic position.
- Classification uncertainty: trains, vehicles, wind, machinery, and excavation can produce overlapping signatures. An automated event label is a model inference, not independent confirmation.
- Sampling and processing: pulse repetition rate, gauge length, channel spacing, filters, and alert thresholds trade sensitivity, temporal coverage, and false-alarm rates.
Verification procedure: use independently timestamped and positioned reference events, compare quiet and active periods, record false positives and missed detections, and document the physical units emitted by the specific interrogator. Historical data must match the same cable route and instrument configuration for meaningful comparisons. A system claimed to detect every event needs independent validation; no fixed sensitivity, precision, or range can be inferred solely from the DAS acronym.
A read-only commissioning workflow
- Confirm permission to access the fiber and document the route, cable type, map, splice records, and existing optical services.
- Review interrogator configuration: channel spacing, gauge length, pulse repetition, calibrated distance, and output units.
- Compare a recorded event against independently logged time and location. Assess noise and attenuation along the route.
- Inspect false positives and quiet sections. Document uncertainty, missed events, and changes in cable coupling.
- Preserve versioned settings and sign off only against the approved sensing acceptance criteria.
Safety boundary: Never look into an optical connector, disconnect an in-service fiber, or inject laser signals without authorization and approved test procedures. Optical monitoring does not replace railway operations controls or physical inspection. Review OSFOEC.013 on validating OTDR event data and OSFOEC.015 on Brillouin strain sensing.
Exercise and answer key
Question 1: A system reports 1-meter channel spacing but a 10-meter gauge length. Are neighboring measurements independent? Answer: Not necessarily; their measurement regions overlap.
Question 2: Can a strong event on a DAS record prove a pipeline leak? Answer: No. Additional classification, independent evidence, and validation against other vibration sources are needed. Takeaway: DAS supplies location-resolved deformation evidence, not automatic certainty about the event source.
Question 3: Explain the difference between Rayleigh backscatter and the interrogator. Answer: Rayleigh backscatter is a weak optical signal returning from microscopic variations within the glass; the interrogator launches pulses, detects returning light, and processes its timing and phase.
Question 4: A fiber segment 10 meters long extends by 0.1 millimeter over 0.5 seconds. What are its approximate strain and average strain rate? Answer: 10 µε and 20 µε/s, respectively. The values are illustrative, not field measurements.
Question 5: Why can DAS be more appropriate for tracking railway vibrations than a temperature sensor or isolated FBGs? Answer: DAS can measure dynamic strain across many virtual positions along an existing suitable fiber. DTS primarily estimates temperature, while FBGs monitor the locations of installed gratings. The actual suitability still depends on sensitivity, cable coupling, distance calibration, and verified alarm performance.
We volunteer daily to ensure the credibility of the information on this platform is Verifiably True. If you would like to support to help further secure the integrity of our research initiative, please scan the QR code below.



Leave a Reply