
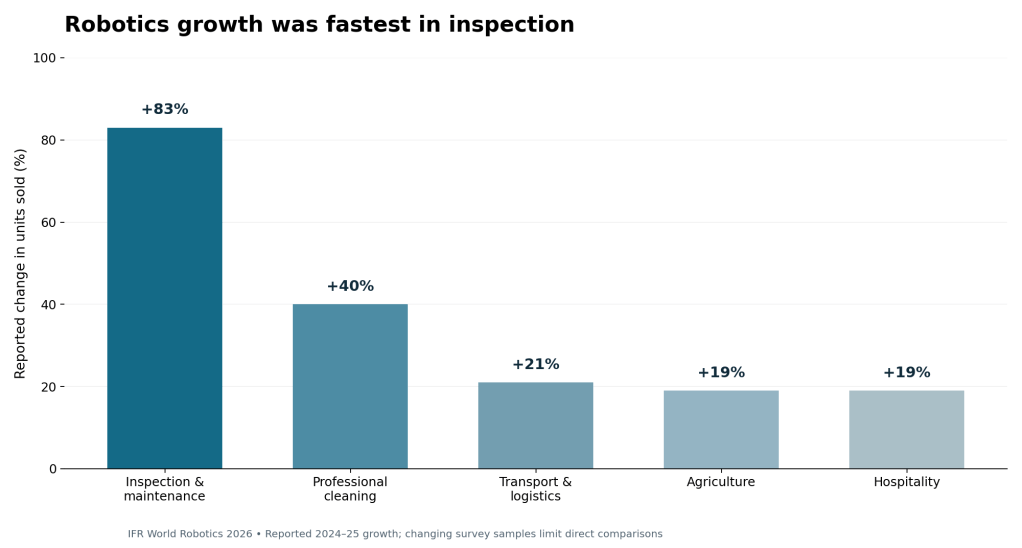
Nearly half of the professional service robots sold worldwide in 2025 were built to move goods. The International Federation of Robotics (IFR) reported on September 30, 2026 that professional service-robot sales rose 24% to almost 250,000 units. Transportation and logistics accounted for 117,488 robots, or about 47% of the surveyed total. Yet the fastest-growing application was not warehousing: inspection and maintenance sales increased 83% in the IFR’s reported comparison.
CNBC examines autonomous inventory robots and retail shelf monitoring. The 2023 documentary provides operational background, not footage or measurements from the IFR’s 2026 report. Watch the original CNBC documentary.
The robot sales mix: 47% logistics, 22% hospitality
The IFR’s World Robotics 2026 market presentation, slide 29, provides a six-category breakdown totaling 249,568 professional robots. Transport and logistics led with 117,488 units. Hospitality followed with 55,941, professional cleaning with 44,644, agriculture with 17,141, miscellaneous applications with 7,887, and inspection and maintenance with 6,467. The values refer to 2025 unit sales, not robots still operating or revenue generated.
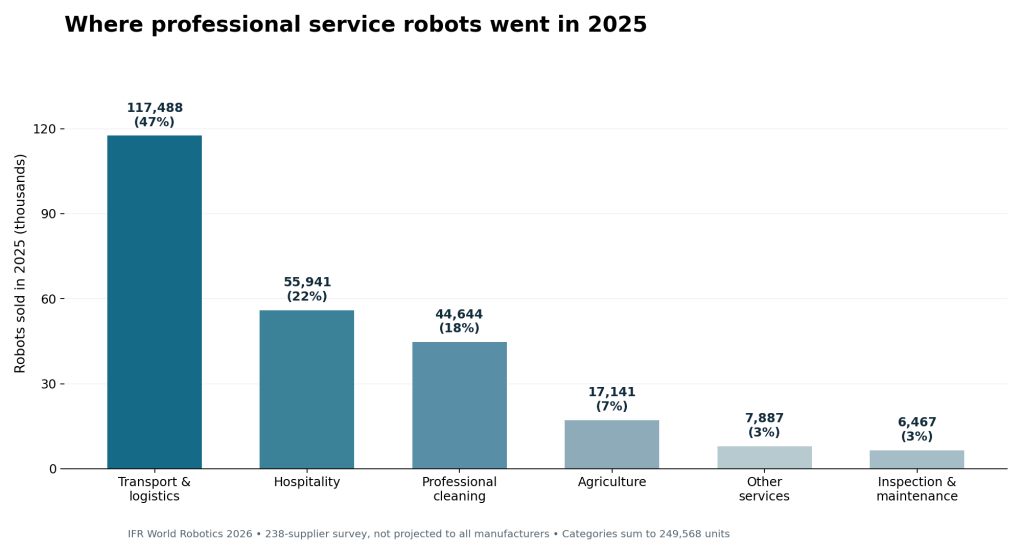
Mobile platforms have a practical advantage in structured workplaces. Warehouses can standardize routes, maps, loading points and traffic rules, allowing robots to move pallets, totes and packages without needing general-purpose hands. Machines that reliably transport goods can therefore scale commercially sooner than complex humanoids capable of handling varied objects.
Inspection grows 83%, cleaning rises 40%
The IFR’s application growth comparison lists 83% for inspection and maintenance, 40% for professional cleaning, 21% for transport and logistics, and 19% each for agriculture and hospitality. Inspection had the fastest percentage gain but the smallest unit total among the named top-five groups. A high percentage from a smaller base does not mean the segment sold the most machines.
Humanoid publicity exceeds demonstrated adoption
The same IFR briefing separately counts about 7,000 full-size humanoid robots sold for professional use in 2025. Researchers say many remain in specialized pilots or need teleoperation. Humanoid sales must not be added to the professional-service totals without checking category overlap. Meanwhile, consumer service-robot sales reached almost 34.2 million, dominated by mass-market domestic machines, a separate category with a much larger unit market.
CNBC International tours Agility Robotics’ RoboFab and discusses the Digit humanoid’s proposed warehouse tasks. The 2024 factory tour illustrates industrial development, not verified sales under IFR’s 2025 classifications. Watch the CNBC factory report.
The survey does not count every robot
A crucial methodological limit appears in the original IFR presentation: the 2026 results use a sample of 238 suppliers from approximately 1,001 identified manufacturers. Values are not extrapolated to the whole industry, and participating suppliers change between survey waves. Consequently, reported growth rates should not be mistaken for a complete global market census. Medical robotics is tracked separately; the IFR reports 15,300 medical robots, including 8,400 surgical robots, in 2025.
Related BitcoinVersus.Tech reporting examines Rockwell Automation and AGILOX mobile robots, GXO’s proposed Apollo humanoid trials, Serve Robotics’ sidewalk fleet software, and the separate industrial-robot installation market. The distinctions between shipped, trialed, deployed and operating equipment matter.
What the statistics actually show
Warehouses and logistics remain the largest surveyed professional-service market by units, while less mature categories can record much faster percentage growth. For operators, the relevant measures extend beyond shipments: uptime, mean interventions between failures, safety performance, cost per completed task and human oversight requirements determine whether automation delivers lasting value.
Primary sources and method: IFR September 30 press release; IFR World Robotics 2026 slides 28–32. Totals and chart labels are reproduced from published supplier-survey values, with percentages rounded as IFR specifies.
We volunteer daily to ensure the credibility of the information on this platform is Verifiably True. If you would like to support to help further secure the integrity of our research initiative, please scan the QR code below.



Leave a Reply