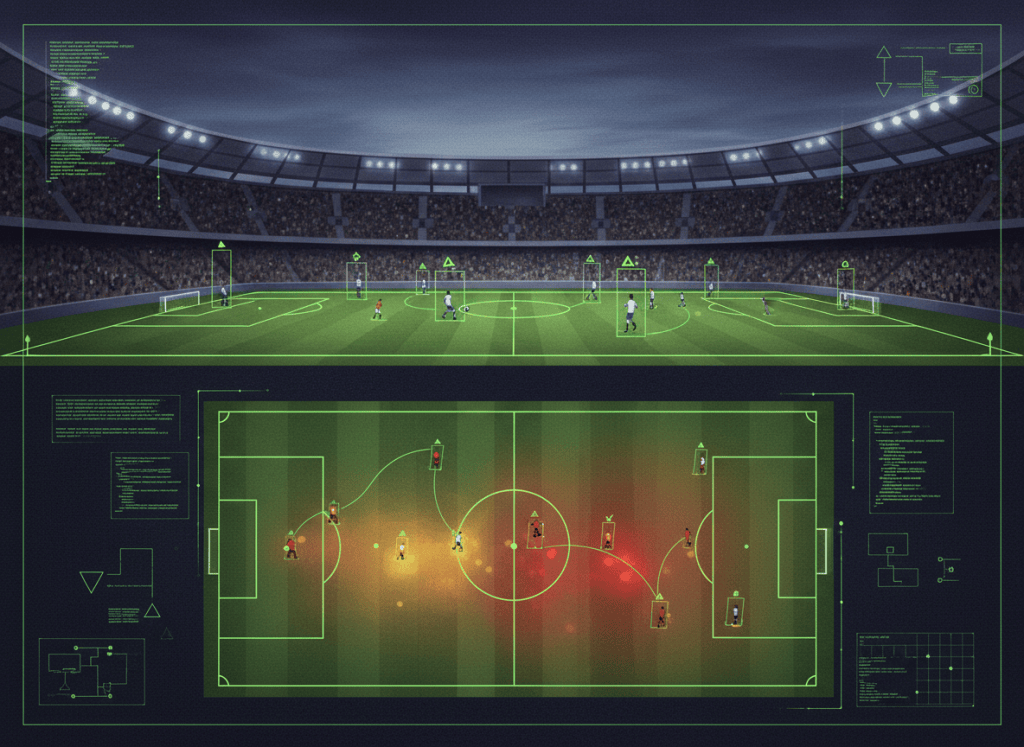
A football broadcast can now be treated like a live dataset. A recent Labellerr AI demo shows a computer-vision pipeline using YOLO, OpenCV and annotated sports footage to detect players, follow them across frames and convert their movement into live heatmaps.
The September 7 demonstration from Labellerr AI is a compact example of where sports coding is heading: ordinary video becomes structured tracking data without asking every athlete to wear a sensor.
The first coding problem is detection
At the front of the pipeline is an object detector. A YOLO-family model processes each video frame and returns bounding boxes around objects such as players, referees and the ball. The output is not yet “football intelligence.” It is a stream of coordinates, confidence scores and object classes.
From there, OpenCV handles much of the frame-by-frame image processing and visualization work. The coding challenge is to preserve identity across frames so the player detected at frame 120 is still recognized as the same player at frame 121, even after occlusion, camera movement or a collision.
Roboflow engineer Piotr Skalski previously shared the open-source football AI stack behind player detection, tracking, team clustering and camera calibration.
Tracking is harder than drawing a box
A detector can find 22 players in one image. Sports analytics needs to know which player is which for hundreds or thousands of consecutive frames.
That means the tracker has to survive fast cuts, motion blur, players crossing in front of one another and the camera panning away from the original coordinate system. A robust pipeline associates new detections with existing tracks using position, motion and appearance cues rather than treating every frame as a clean slate.
Camera calibration turns pixels into football coordinates
The next major step is geometry. A television camera sees a perspective-distorted trapezoid; analysts want a stable top-down pitch where one meter means one meter no matter where the broadcast camera points.
Computer-vision code solves that with pitch keypoints and a geometric transform. Once recognizable field markings are mapped from the broadcast frame to a canonical pitch, player tracks can be projected into tactical coordinates. That is what turns a sequence of bounding boxes into a formation map, passing shape or heatmap.
Heatmaps are just accumulated coordinates
Once a player has a stable track on a calibrated pitch, a heatmap becomes a data-engineering problem. Each location sample is added to a spatial grid, weighted and smoothed. High-density regions become the bright zones that coaches and analysts use to understand positioning and workload.
The same pipeline can calculate average positions, distances covered, pressing zones, team compactness and changes in shape over time. Roboflow’s sports analytics workflow demonstrates how computer-vision detections can be extended into formation analysis and higher-level tactical measurements.
This is the software side of the same sports-data shift
BitcoinVersus.tech recently looked at markerless motion capture in Premier League performance testing. The football-video pipeline is conceptually similar: extract body or player movement from cameras first, then convert it into structured data.
Our report on TDK’s Smart Javelin showed the opposite architecture—put the sensor inside the sporting object. Computer vision moves the instrumentation outside the athlete and into software.
And FIFA’s wearable-tracking standards show how the two approaches can complement each other. GPS and inertial sensors measure the body directly; video analytics adds tactical context about where every other player was at the same moment.
The coding stack is becoming accessible
What once required a proprietary stadium tracking system can increasingly be prototyped with Python, a modern detector, OpenCV and ordinary match footage. The hard parts have not disappeared—identity switching, ball detection, calibration drift and real-time performance remain serious engineering problems—but the barrier to experimentation is much lower.
That makes sports analytics a useful coding laboratory. A developer can start with one video frame, then progressively add detection, tracking, clustering, geometry and temporal statistics until the broadcast becomes a machine-readable model of the match.
BitcoinVersus.Tech
Advertisement
Editor’s Note
We volunteer daily to ensure the credibility of the information on this platform is Verifiably True. If you would like to support to help further secure the integrity of our research initiatives, please donate here: 3C9o19EH5HSiwEPyCTmEKzxhNCbo2X6TTb
BitcoinVersus.tech is not a financial advisor. This media platform reports on financial subjects purely for informational purposes.


Leave a Reply