Bitcoin mining hardware has an unusually clean way to describe performance: terahashes per second tells you how much work a machine can do, while joules per terahash tells you how much energy it needs to do that work. AI hardware needs the same kind of language. For large-language-model inference, the closest practical equivalents are tokens per second for productive throughput and joules per token for energy efficiency.
This report counts down from #7 to #1 across seven leading AI accelerator platforms using real inference benchmark data rather than advertised TOPS or theoretical FLOPS. The common workload is OpenAI gpt-oss-120B in FP4 on an 8,000-token input and 1,000-token output single-turn chat workload. For six accelerators, throughput is read at the same 50 output tokens per second per user service level. The seventh, NVIDIA GB200 NVL72, is included as a rack-scale reference because real benchmark data exists but a 50-tok/s/user result is not currently published.
The throughput measurements come from SemiAnalysis InferenceX, which runs workloads on real hardware and publishes reproducible benchmark runs. Energy per token is derived from those measured throughput results and InferenceX’s standardized all-in system power allocation. That power boundary includes more than the accelerator’s nameplate board rating, making it closer to the way a mining operator thinks about the machine as an operating system rather than a theoretical chip.
The countdown
| Rank | Accelerator | Throughput | Power boundary | J/token | Benchmark target |
|---|---|---|---|---|---|
| 7 | AMD MI325X | 4,782 tok/s | ≈1.69 kW | 0.3534 | 50 tok/s/user |
| 6 | AMD MI300X | 8,067 tok/s | ≈1.39 kW | 0.1723 | 50 tok/s/user |
| 5 | NVIDIA H100 | 8,973 tok/s | ≈1.37 kW | 0.1527 | 50 tok/s/user |
| 4 | NVIDIA H200 | 9,319 tok/s | ≈1.37 kW | 0.1470 | 50 tok/s/user |
| 3 | AMD MI355X | 38,497 tok/s | ≈2.09 kW | 0.0543 | 50 tok/s/user |
| 2* | NVIDIA GB200 NVL72 | 42,816 tok/s/GPU-equivalent | ≈1.87 kW | 0.0437 | 113 tok/s/user* |
| 1 | NVIDIA B200 | 44,489 tok/s | ≈1.71 kW | 0.0384 | 50 tok/s/user |
*GB200 NVL72 is not a strict iso-interactivity ranking point. Its published benchmark comparison is shown at 113 tok/s/user because InferenceX does not currently publish a 50-tok/s/user ladder point for this rack-scale configuration. It is included because the user asked for seven leading accelerators, but the asterisk matters.
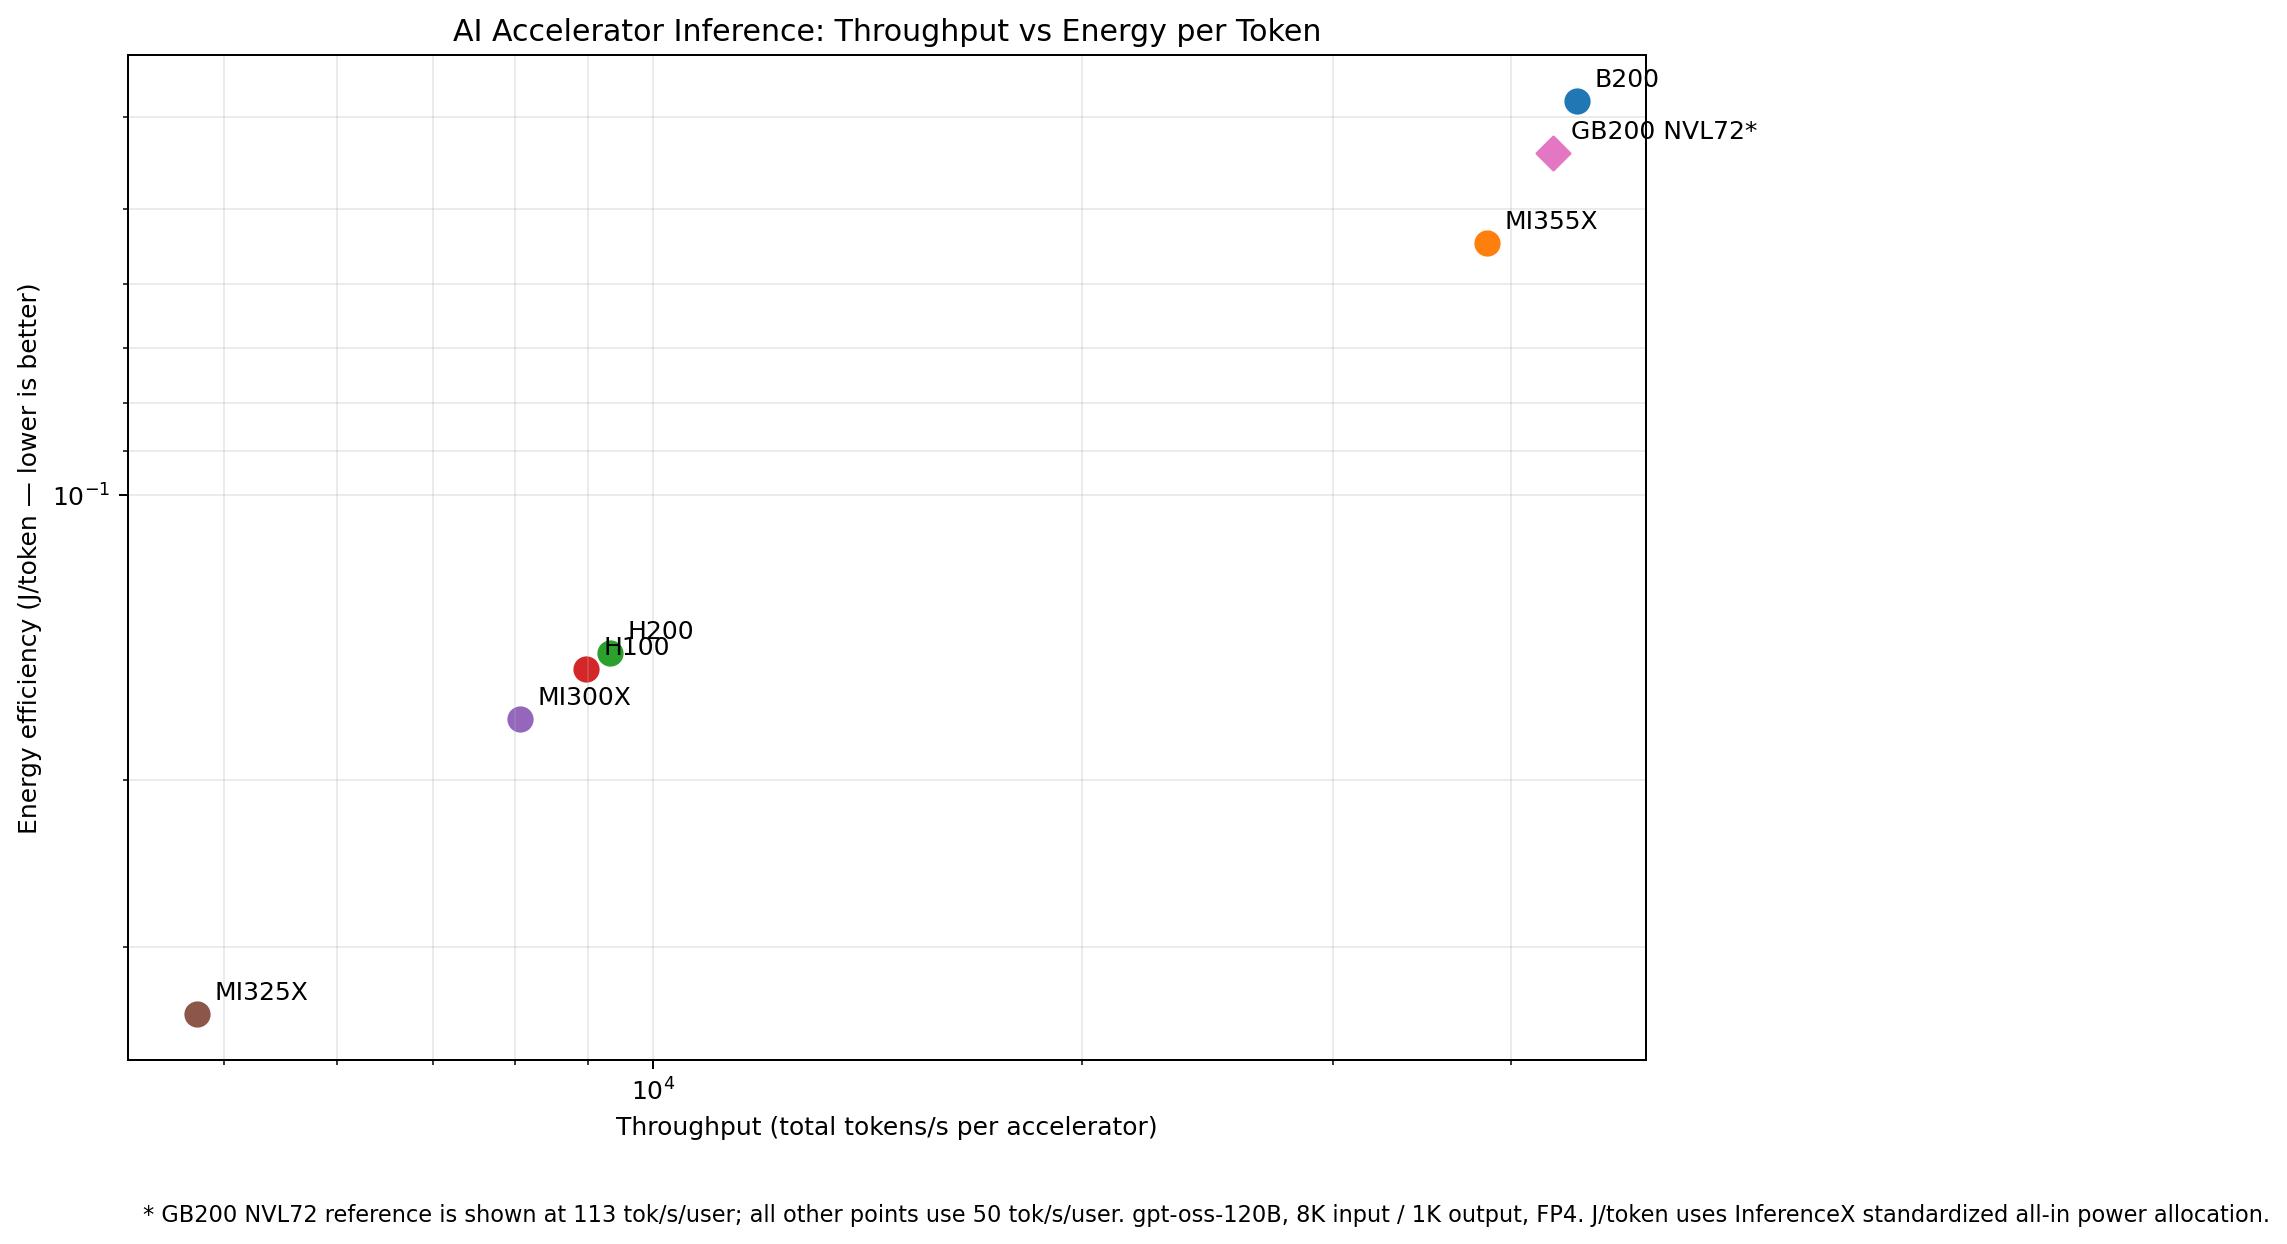
The mining-style view: move right for more tokens per second and toward lower J/token for greater energy efficiency. GB200 NVL72 is separately flagged because its published operating point is more demanding.
Why J/token is the AI equivalent of J/TH
A bitcoin miner rated at 200 TH/s and 20 J/TH tells an operator two things immediately: the productive rate and the energy cost of each unit of work. The equivalent inference notation is just as simple. Tokens per second answers “how much model output can the hardware serve?” Joules per token answers “how much energy does each unit of that output consume?”
The dimensional math is direct. One watt equals one joule per second. Therefore:
J/token = watts ÷ tokens/second.
Its inverse is tokens per joule. Lower J/token is better, exactly like lower J/TH is better in Bitcoin mining. This is more useful for deployment economics than comparing advertised TOPS, because TOPS describes theoretical arithmetic capability at a specified datatype. It does not tell you how quickly a real model serves users, how much of the chip is actually utilized, or how much infrastructure power accompanies the accelerator.
Readers who want the software foundation behind the NVIDIA results can start with BitcoinVersus.Tech’s CUDA explainer. Our CPU vs. GPU vs. NPU guide explains why parallel accelerators dominate this kind of inference, while our report on GPU-accelerated financial data processing shows that the same architecture is moving beyond model inference into large-scale data workloads.
A critical power-measurement warning
These J/token figures are not being presented as MLPerf wall-meter power submissions. That distinction is important. The official MLCommons MLPerf power methodology requires a certified power analyzer and SPEC PTDaemon, with electrical power to the system under test passing through the analyzer. That is the gold-standard path for directly metered energy.
The current public LLM benchmark ecosystem does not yet give us seven recent accelerator families with directly metered, apples-to-apples MLPerf power results on the same modern language model. So this report does not substitute vendor TDP and pretend that it is wall power. Instead, it combines measured InferenceX throughput with InferenceX’s disclosed all-in system power allocation. The resulting J/token is therefore a derived system-efficiency metric, not a certified wall-meter measurement.
That makes this report useful for relative infrastructure comparison today while also defining the standard we should demand tomorrow: same model, same precision, same prompt/output lengths, same per-user service level, same serving class, and direct power instrumentation.
7. AMD Instinct MI325X — 4,782 tok/s, 0.3534 J/token
MI325X ranks last in this specific 8K/1K FP4 gpt-oss-120B comparison. At the common 50-tok/s/user service level it produces 4,782 tok/s. With an all-in allocation near 1.69 kW, the derived efficiency is approximately 0.3534 J/token, or only about 2.83 tokens per joule.
That does not mean MI325X is universally a poor accelerator. It means this model, engine, precision and service level are unfavorable relative to the other platforms tested here. The same caution applies to every ranking in this article. A different model architecture, longer context, larger batch, different kernel implementation or different serving engine can change the order.
AMD’s verified Advancing AI 2024 keynote introduces MI325X and places it in the Instinct accelerator roadmap.
6. AMD Instinct MI300X — 8,067 tok/s, 0.1723 J/token
MI300X posts 8,067 tok/s at the matched service level, with a standardized all-in allocation near 1.39 kW. That gives about 0.1723 J/token, or 5.8 tokens per joule. The throughput is below both Hopper entries in this particular model and software configuration, but the result is still close enough to show why real model benchmarking matters more than comparing theoretical arithmetic rates.
MI300X also provides the baseline that makes MI355X’s leap so visible. If AI hardware efficiency is going to be discussed the way miner efficiency is discussed, generational comparisons should use the same model and service-level rules rather than cherry-picking a different model for each new accelerator.
AMD’s official introduction to the Instinct MI300 series explains the architecture and deployment role of MI300X.
5. NVIDIA H100 — 8,973 tok/s, 0.1527 J/token
H100 remains remarkably competitive. The measured 8,973 tok/s at the common 50-tok/s/user point places it only modestly behind H200. At the same approximately 1.37 kW standardized all-in power boundary, it comes to about 0.1527 J/token, or 6.55 tokens per joule.
This illustrates an important difference between AI and Bitcoin mining hardware. Miner workloads are deliberately fixed: SHA-256 is SHA-256. AI software stacks evolve rapidly. Runtime, kernel, quantization and batching improvements can materially change the effective throughput of hardware that has already been deployed. Any J/token leaderboard therefore needs a timestamp and software configuration.
NVIDIA’s official DGX H100 tour shows the H100-based system architecture used to build large AI infrastructure.
4. NVIDIA H200 — 9,319 tok/s, 0.1470 J/token
H200 is the most efficient of the Hopper-class entries in this test. It produces 9,319 tok/s at the matched 50-tok/s/user target. With about 1.37 kW of standardized all-in allocation, that converts to approximately 0.1470 J/token, or 6.8 tokens per joule.
The result also shows why memory upgrades can matter even when the basic compute generation remains related. H200 improves on H100’s throughput and J/token on this large model rather than simply increasing capacity for models that do not fit comfortably into smaller memory footprints.
Linus Tech Tips examines a real H200 NVL accelerator, including its HBM memory system and hands-on benchmark testing.
3. AMD Instinct MI355X — 38,497 tok/s, 0.0543 J/token
AMD’s MI355X is the strongest direct challenger in this matched workload. It reaches 38,497 tok/s at 50 tok/s/user with vLLM FP4. The standardized system allocation is higher than B200 at about 2.09 kW, so the efficiency lands at approximately 0.0543 J/token, or about 18.4 tokens per joule.
The important part is not that MI355X loses this specific ranking. It is how far AMD has moved the curve. MI355X produces more than four times the matched throughput of MI300X in this benchmark while its derived J/token is roughly one-third as high. That is the kind of generational change that resembles a major ASIC-miner efficiency jump rather than a small refresh.
AMD’s official overview of the Instinct MI350 family covers the CDNA 4 generation that includes MI355X.
2. NVIDIA GB200 NVL72 — rack-scale reference at 0.0437 J/token
GB200 NVL72 deserves separate treatment because it is not simply a standalone GPU card. It is a liquid-cooled rack-scale system built around Grace CPUs, Blackwell GPUs and a large NVLink domain. InferenceX has real gpt-oss-120B measurements, but its public run page does not currently expose the same 50-tok/s/user ladder point available for the six accelerator results above.
At a published 113-tok/s/user comparison point, GB200 delivers about 42,816 tokens per second per GPU-equivalent. The normalized all-in allocation is about 1.87 kW per accelerator equivalent, yielding roughly 0.0437 J/token. That is extraordinary efficiency at a substantially faster individual-user service level. But because the latency target differs, it should not be read as proof that GB200 is exactly second at the common 50-tok/s/user point.
ServeTheHome examines the power and cooling demands of modern rack-scale AI hardware, including the roughly 120 kW GB200 NVL72 class of system.
1. NVIDIA B200 — 44,489 tok/s, 0.0384 J/token
The B200 is the clear single-accelerator leader in this test. InferenceX measured 44,489 total tokens per second at the 50-tok/s/user target with gpt-oss-120B, 8K input, 1K output and FP4 under vLLM. Using the standardized all-in power allocation of about 1.71 kW, the result is approximately 0.0384 joule per token, or about 26 tokens per joule.
That combination is what makes the B200 mining-like: it is not simply the fastest of the six strictly matched GPUs; it is also the most energy-efficient at that operating point. A faster chip that consumed proportionally more system power would not necessarily win J/token. Here, B200 wins both axes.
ServeTheHome tours a production NVIDIA B200 cluster and shows the servers, networking, cooling and power infrastructure behind the accelerator.
What this ranking says
The most important result is not NVIDIA versus AMD. It is that AI inference can be described with a miner-style pair of metrics that normal operators can understand. The B200 result is effectively the AI equivalent of a miner combining extremely high TH/s with a low J/TH figure: 44,489 measured tokens per second at the target service level and a derived 0.0384 J/token system efficiency.
MI355X is close enough to establish a genuine second high-performance class. The Hopper and CDNA 3 accelerators sit much farther back on this particular workload. At the same time, GB200 shows that rack-scale architectures introduce another dimension. Its NVLink fabric, CPU integration, networking and liquid cooling make “per GPU” accounting less clean than it is for a single accelerator module.
The metric BitcoinVersus.Tech should track
For future AI-hardware reports, the cleanest notation is:
- Power: total tokens per second (tok/s)
- Efficiency: joules per output token (J/token)
- Service quality: output tokens per second per user
- Latency guardrail: time to first token
Every ranking should also lock model, quantization, input/output lengths and serving software. Without those controls, J/token can be gamed just as badly as a mining comparison would be if one manufacturer measured SHA-256 and another measured a completely different algorithm.
The next step for the industry is straightforward: combine the reproducibility and real-hardware throughput discipline of systems such as InferenceX with MLPerf-style certified wall-power measurement. When that dataset exists across modern accelerators, AI buyers will finally be able to compare machines the way Bitcoin miners have compared ASICs for years: productive rate on one line, joules per unit of work on the next.
BitcoinVersus.Tech Editor’s Note:
We volunteer daily to ensure the credibility of the information on this platform is Verifiably True. If you would like to support to help further secure the integrity of our research initiatives, please donate using the QR code provided

For best QR-code scanning results, please scan this donation code from a desktop or larger screen. Mobile screens may prevent camera recognition.


Leave a Reply