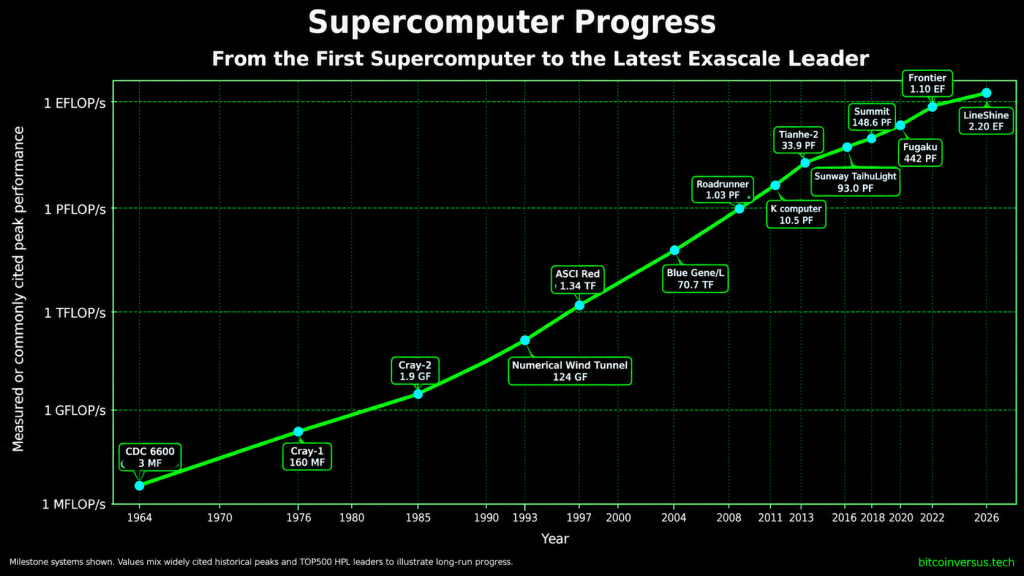
Supercomputing has moved from millions of floating-point operations per second to more than two quintillion. The chart below tracks milestone machines from the CDC 6600 in 1964 through LineShine in 2026 and shows just how steep that climb became.
This is a follow-up to BitcoinVersus.Tech’s FLOPS vs Hashrate explainer and our 7 Fastest Supercomputers in the World ranking. The early points below use widely cited historical peak figures, while the modern era increasingly uses standardized TOP500 HPL measurements. That means the percentage jumps are best read as generational progress, not as a perfectly identical benchmark across all 62 years.
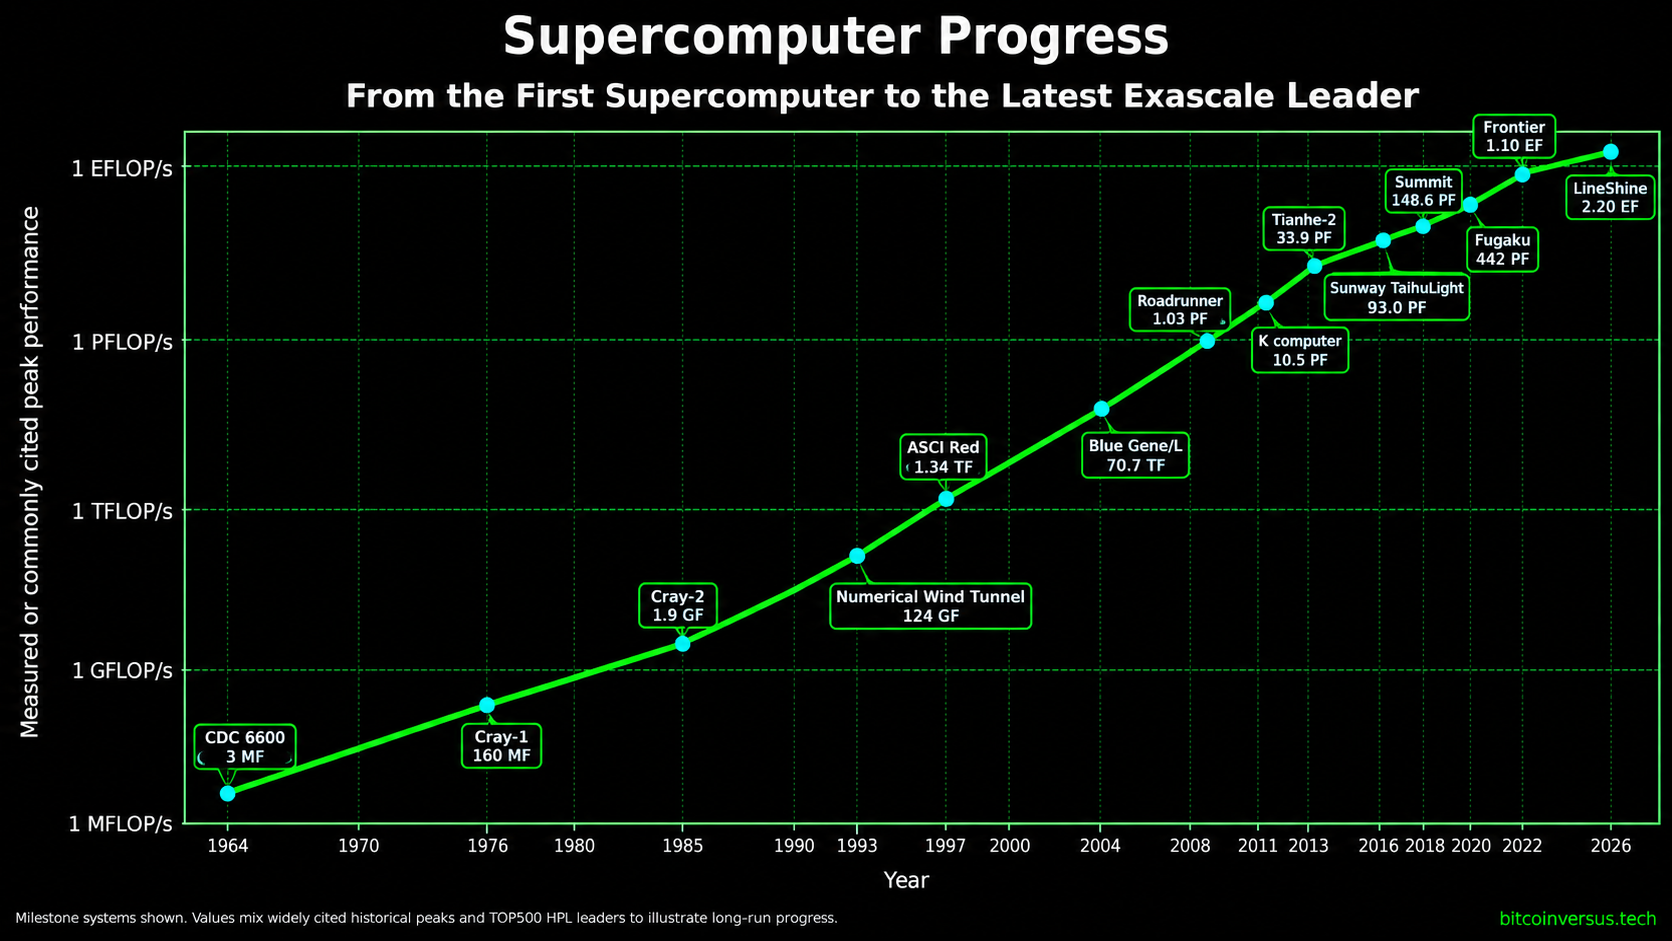
Across the full chart, performance increases by roughly 732.8 billion times from 3 MFLOP/s to 2.1984 EFLOP/s—equivalent to an increase of about 73.28 trillion percent. The most famous middle milestone is the jump from petascale to exascale: Roadrunner became the first 1-PFLOP/s machine in 2008, and Frontier became the first true 1-EFLOP/s HPL machine in 2022, roughly 14 years later. TOP500 documents Roadrunner at 1.026 PFLOP/s and Frontier at 1.102 EFLOP/s.
| Year | System | Chart performance | Increase vs. prior milestone |
|---|---|---|---|
| 1964 | CDC 6600 | 3 MFLOP/s | Baseline |
| 1976 | Cray-1 | 160 MFLOP/s | +5,233.3% |
| 1985 | Cray-2 | 1.9 GFLOP/s | +1,087.5% |
| 1993 | Numerical Wind Tunnel | 124 GFLOP/s | +6,426.3% |
| 1997 | ASCI Red | 1.338 TFLOP/s | +979.0% |
| 2004 | Blue Gene/L | 70.72 TFLOP/s | +5,185.5% |
| 2008 | Roadrunner | 1.026 PFLOP/s | +1,350.8% |
| 2011 | K computer | 10.51 PFLOP/s | +924.4% |
| 2013 | Tianhe-2 | 33.86 PFLOP/s | +222.2% |
| 2016 | Sunway TaihuLight | 93.01 PFLOP/s | +174.7% |
| 2018 | Summit | 148.6 PFLOP/s | +59.8% |
| 2020 | Fugaku | 442.01 PFLOP/s | +197.4% |
| 2022 | Frontier | 1.102 EFLOP/s | +149.3% |
| 2026 | LineShine | 2.1984 EFLOP/s | +99.5% |
CDC 6600 — 1964
Often described as the first true supercomputer, Seymour Cray’s CDC 6600 established the category in 1964 at roughly 3 MFLOP/s. It is the baseline for this chart: a machine measured in millions of floating-point operations per second at a time when most computers were dramatically slower.
Cray-1 — 1976
The Cray-1 pushed the chart to roughly 160 MFLOP/s, a 5,233.3% increase over the CDC 6600 baseline. Its vector-processing architecture became synonymous with high-performance computing and established the visual language of the classic supercomputer.
Cray-2 — 1985
The Cray-2 moved the milestone line into gigaflops at roughly 1.9 GFLOP/s. Compared with the Cray-1 figure on the chart, that is another 1,087.5% increase, or nearly 11.9× more floating-point throughput.
Numerical Wind Tunnel — 1993
Japan’s Numerical Wind Tunnel represents one of the biggest leaps on the chart: roughly 124 GFLOP/s, a 6,426.3% increase over the Cray-2 figure. The machine helped demonstrate that massively parallel computing could outrun the traditional vector-supercomputer model.
ASCI Red — 1997
ASCI Red at Sandia crossed the teraflop barrier. The chart uses its later 1.338 TFLOP/s TOP500 result, which is 979.0% above the 124-GFLOP/s Numerical Wind Tunnel point. TOP500 records ASCI Red as the first teraflop-class system and the No. 1 machine of its era.
Blue Gene/L — 2004
IBM’s Blue Gene/L moved the chart to roughly 70.72 TFLOP/s, a 5,185.5% increase from ASCI Red’s 1.338-TFLOP/s point. Blue Gene showed how enormous numbers of relatively modest processors could be organized into an extremely powerful and comparatively energy-conscious machine.
Roadrunner — 2008
IBM’s Roadrunner at Los Alamos became the first supercomputer to sustain more than one petaflop on Linpack, reaching 1.026 PFLOP/s. Relative to the 70.72-TFLOP/s Blue Gene/L point plotted here, that is a 1,350.8% increase. TOP500 identifies Roadrunner as the machine that officially opened the petascale era.
K computer — 2011
Japan’s K computer reached 10.51 PFLOP/s in 2011, becoming the first system to exceed 10 petaflops. That represented a 924.4% increase from Roadrunner’s 1.026-PFLOP/s result—about 10.2× more performance in only three years.
Tianhe-2 — 2013
China’s Tianhe-2 raised sustained Linpack performance to 33.86 PFLOP/s. Compared with the K computer’s 10.51 PFLOP/s, that was a 222.2% increase. Its arrival also marked China’s return to the No. 1 position on TOP500.
Sunway TaihuLight — 2016
Sunway TaihuLight reached 93.01 PFLOP/s in 2016. That was a 174.7% increase over Tianhe-2. The system was also strategically significant because it relied on Chinese-designed Sunway processors rather than the accelerator-heavy architecture used by several other contemporary leaders.
Summit — 2018
Oak Ridge’s Summit delivered roughly 148.6 PFLOP/s, a 59.8% increase over Sunway TaihuLight. The percentage jump was smaller than many earlier transitions, but Summit was important because its IBM POWER9 CPUs and NVIDIA GPUs anticipated the increasingly accelerator-heavy architecture used in both scientific computing and AI.
Fugaku — 2020
RIKEN and Fujitsu’s Fugaku pushed HPL performance to 442.01 PFLOP/s. That was a 197.4% increase over Summit and nearly tripled the plotted milestone in two years. Fugaku’s Arm-based A64FX architecture also proved that leadership did not require copying the dominant CPU-plus-discrete-GPU formula.
Frontier — 2022
Frontier at Oak Ridge became the first true exascale machine on the TOP500 with an HPL score of 1.102 EFLOP/s. That was a 149.3% increase over Fugaku’s 442.01 PFLOP/s result. Measured from Roadrunner’s first petaflop in 2008, reaching Frontier’s exaflop required roughly 1,074× more performance in about 14 years.
LineShine — 2026
LineShine at the National Supercomputing Centre in Shenzhen reached 2.1984 EFLOP/s on the June 2026 TOP500. That is a 99.5% increase over Frontier’s 2022 milestone—essentially doubling the first exascale result. TOP500 says LineShine is the first listed machine to exceed two exaflops of sustained double-precision HPL performance using CPUs only.
What the curve tells us
The curve is not smooth because supercomputing progresses through architectural jumps. Vector processors gave way to massive parallelism; commodity processors became viable at enormous scale; accelerators changed the performance-per-watt equation; and modern systems increasingly combine specialized CPUs, GPUs, memory systems and high-speed interconnects. Our AI accelerator ranking shows the same specialization now reshaping inference infrastructure.
The historical milestones are documented across the TOP500 historical archive, while the June 2026 list records LineShine’s arrival at No. 1. The next frontier will not be raw FLOPS alone. Power efficiency, memory bandwidth, networking, cooling and useful performance per watt will determine how far the curve can continue rising.
BitcoinVersus.Tech Editor’s Note:
We volunteer daily to ensure the credibility of the information on this platform is Verifiably True. If you would like to support to help further secure the integrity of our research initiatives, please donate using the QR code provided

For best QR-code scanning results, please scan this donation code from a desktop or larger screen. Mobile screens may prevent camera recognition.


Leave a Reply