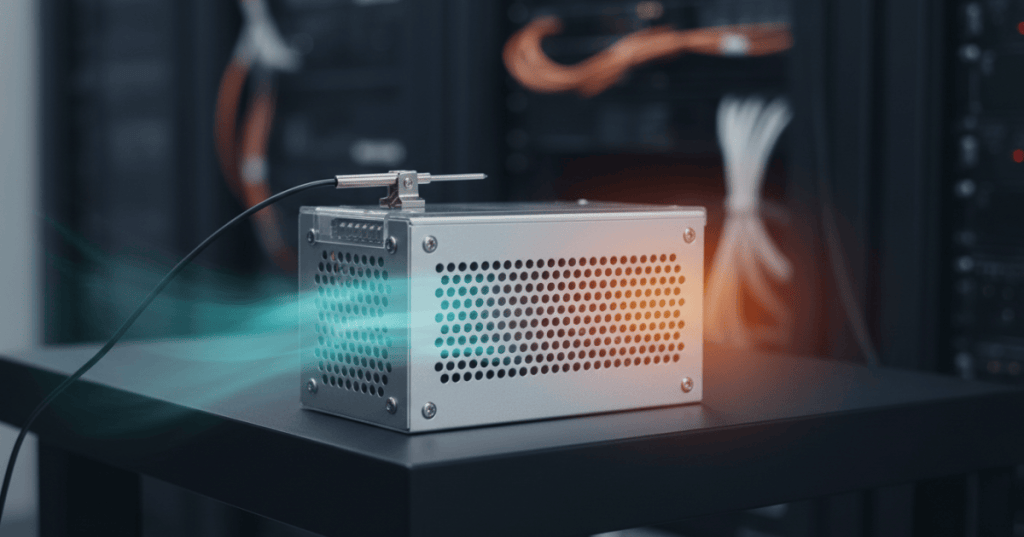
A 300-watt power supply cannot necessarily deliver 300 watts under every temperature, input-voltage or cooling condition. Manufacturers publish derating curves to define how much output remains available as conditions change. The curves matter when engineers choose power supplies for data centers, network racks, industrial machinery and electronics exposed to heat.
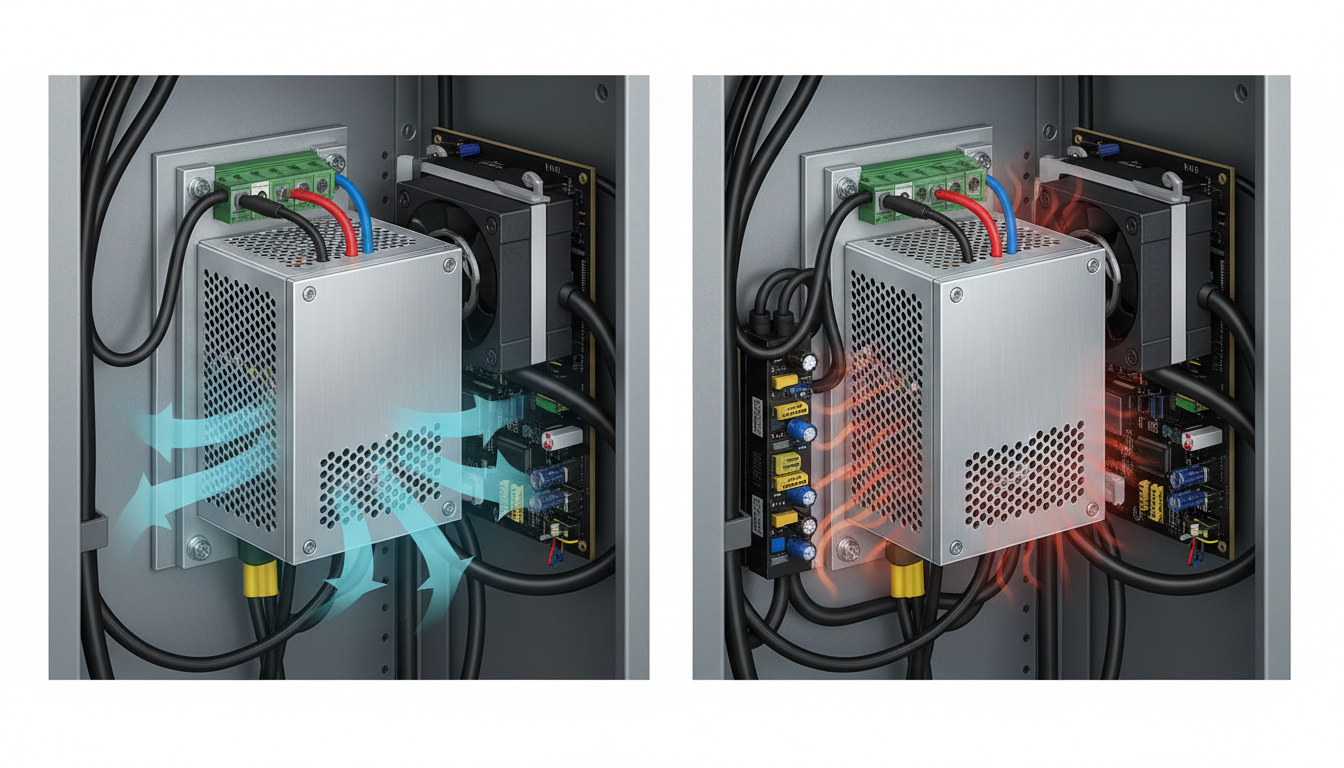
A power-supply rating describes operation under specified test conditions, not unlimited performance. Internal electrical losses generate heat, while surrounding air temperature, enclosure orientation and airflow determine how effectively heat escapes. TDK-Lambda’s engineering guide explains why output ratings may decrease at elevated temperatures, low input voltages or with restricted ventilation.
How to read the graph
Most thermal derating graphs place ambient temperature (°C) on the horizontal axis and permitted output load (%) on the vertical axis. A line at 100% indicates full rated output. After a specified temperature, the line may slope downward, indicating a lower allowable continuous load. Some data sheets instead specify case, baseplate or internal component temperature. Those measurements are not interchangeable.
Low AC input voltage can trigger a separate derating curve because supplying equal power may require more input current and increase heating in rectifiers or other components. Cooling method, installation orientation and altitude can introduce further limitations. The TDK-Lambda guide notes that multiple reduction factors may need to be applied together, depending on the product’s instructions.
Why 300 W can become 180 W
MEAN WELL’s EPP-300 example allows 300 W at 50°C with specified 20.5 cubic feet per minute (CFM) forced airflow. At 60°C, the example permits 225 W. An additional input-voltage condition at 90 V AC applies an 80% factor. The calculation is 225 W × 0.80 = 180 W. The combined figure is 60% of the nominal 300 W rating under the stated conditions—not proof that every 300 W unit behaves identically.
The distinction also affects system sizing. A device expecting 220 W would exceed the 180 W allowable output in the example, even though its load appears comfortably below the power supply’s headline 300 W rating. Correct selection requires checking the exact model’s curves, supply voltage and installed cooling. A larger-rated unit may be necessary; the required margin depends on the specification and operating environment.
Where derating matters
In dense racks, a warm intake or obstructed ventilation path can reduce usable PSU capacity. BitcoinVersus.Tech’s data-center cooling guide explains airflow and temperature management, while its capacity-planning lesson covers rated power versus operational headroom. Similar constraints affect UPS installations, addressed in the site’s UPS engineering lesson.
Thermal derating is not identical to CPU thermal throttling. Derating specifies permissible operating limits for a component under defined conditions; throttling describes active reductions in performance or power to manage temperature. A PSU may instead trip an overtemperature protection circuit when its limits are exceeded.
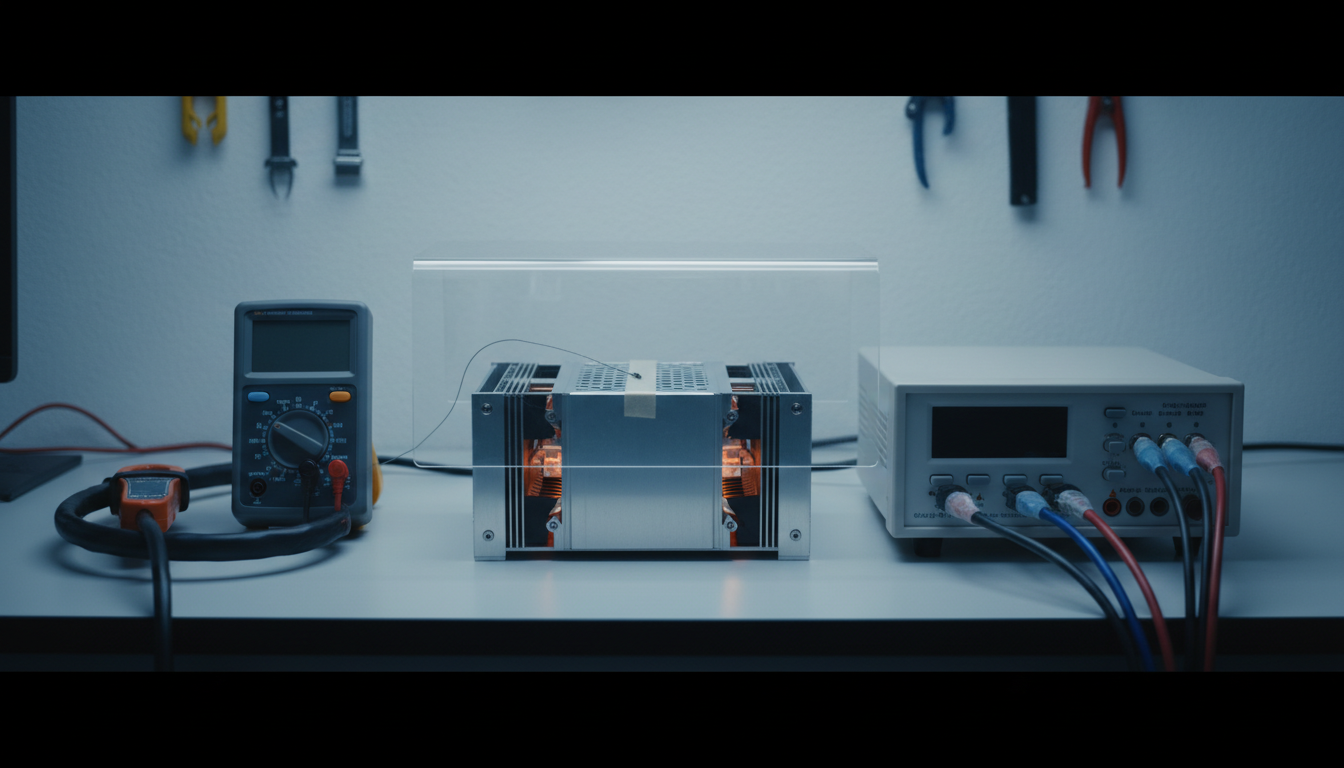
For installation or maintenance, engineers should verify ambient intake temperature, manufacturer-specified airflow, AC input, mounting position and any temperature-sensing point. Hashboard temperature-protection diagnostics illustrates why measured temperatures and fault thresholds matter in another power-intensive application. A datasheet graph provides an operating boundary; qualified testing confirms the assembled system stays inside it.
Sources
TDK-Lambda, power-supply derating guide (2022); MEAN WELL, EPP-300 derating example; TDK-Lambda, output power derating explanation.
Editor’s Note: The 300 W to 180 W example follows MEAN WELL’s stated forced-air, temperature and input-voltage conditions. Do not apply the resulting figure to a different power supply without its specification. In-body imagery and the featured cover are editorial illustrations, not original manufacturer test figures.

We volunteer daily to improve the credibility of the information on this platform. If you would like to support the research, please donate here: 3C9o19EH5HSiwEPyCTmEKzxhNCbo2X6TTb
BitcoinVersus.tech is not a financial advisor. This media platform reports on financial subjects purely for informational purposes.


Leave a Reply