
OSDCTC.017 teaches data-center technicians to assess the risk of condensation where liquid cooling equipment, rack plumbing and server cold plates interact with humid air. A coolant circuit can carry away heat while still causing an electrical reliability hazard if its exposed surface becomes colder than the surrounding air’s dew-point temperature. Effective monitoring requires technicians to correlate air temperature, relative humidity, calculated or measured dew point, coolant supply temperature, local pipe temperature, sensor placement, control state and approved alarm thresholds.
The lesson follows OSDCTC.016, Liquid-Cooling Monitoring, which introduced coolant distribution unit (CDU) flow, temperature and leak telemetry. It also builds on OSDCTC.014 rack-inlet temperature mapping, and the data-center cooling engineering introduction. Condensation screening is a new, focused skill: it is not a repeat of pump and CDU mechanics.
Learning Objectives and Prerequisites
- Define dew point, relative humidity and surface condensation using practical datacenter examples.
- Distinguish the technology cooling system (TCS) from the facility water system (FWS), and confirm which side each sensor measures.
- Compute a dew point from hypothetical air temperature and relative humidity using a cited NOAA formula, then calculate a coolant safety margin.
- Explain why a 2°C temperature buffer appears in ASHRAE TC 9.9 guidance, while recognizing that installed manufacturers’ operating limits take precedence.
- Recognize unsafe or misleading assumptions based on a single wall sensor, a distant return-air temperature or an unverified surface-temperature reading.
- Document a condensation alarm, trend investigation, and escalation without modifying live controls or entering restricted electrical and cooling areas.
- Separate known measurements, modelled values, physically observed moisture, and unresolved fault hypotheses.
Prerequisites: basic Celsius temperature measurement, relative humidity percentages, IT rack and airflow terminology, CDU supply/return concepts, and safe monitoring practices. Equipment for the required exercise is only a spreadsheet or calculator. No physical server, pipe, electrical panel or cooling control is manipulated in the teaching lab. Real investigations must follow facility authorization, electrical safety and manufacturer procedures.
Dew Point Is Not the Same as Relative Humidity
Air contains water vapor. Relative humidity (RH) is the ratio of water-vapor content to the saturation state at a given temperature, expressed as a percentage. The dew point is the temperature at which the same air would become saturated if cooled without a change in vapor content or pressure under the usual approximation. A surface at or below the local dew-point temperature can collect condensed liquid water if exposed to that air. Actual behavior also depends on air movement, moisture transport, surface characteristics and sensor accuracy.
A 60% RH reading alone does not reveal the dew point because warmer air can support a higher saturation vapor pressure. At the same relative humidity, raising the air temperature generally raises the dew point. An instrument that reports both temperature and RH is therefore more useful than an isolated humidity percentage. Some facility sensors calculate dew point internally, and others provide the two input values to the building management system (BMS). The NOAA National Data Buoy Center data-quality handbook, Appendix A documents a reproducible vapor-pressure method used for atmospheric observations.
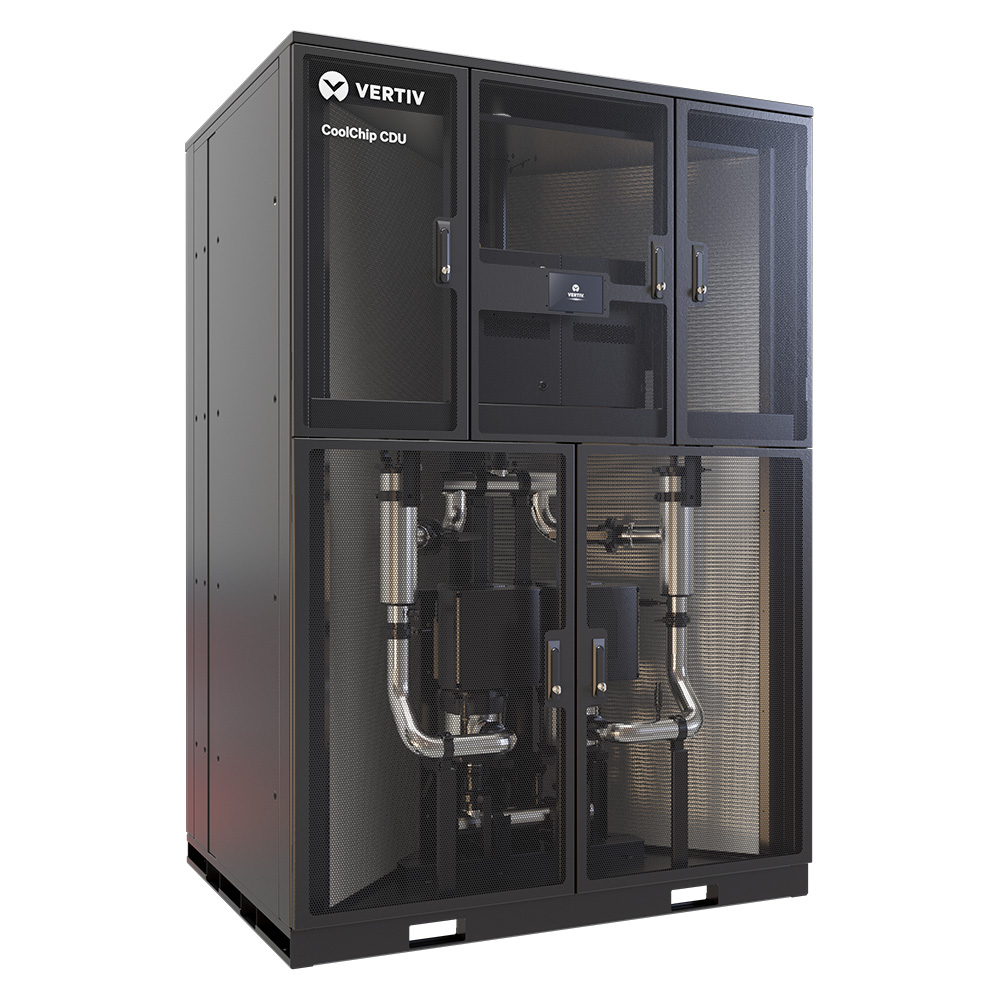
A liquid-cooled rack commonly has at least two distinct environmental measurements: room or rack air conditions, and coolant-loop temperature. A facility may also monitor local pipe-wall temperatures and dew point at several rack locations. When warm, humid room air contacts a cold metal fitting, the local pipe surface—not simply the CDU’s displayed bulk-liquid temperature—determines where moisture can form.
Technology Cooling Water and the 2°C Screening Buffer
The facility water system (FWS) brings cooling capacity from building infrastructure. The technology cooling system (TCS) circulates fluid through IT-side cold plates, manifolds and rack hoses. A liquid-to-liquid CDU often separates the circuits with a heat exchanger. The water temperatures, pressures and quality requirements of the two sides can differ, so a technician must confirm the sensor’s point name, loop and units before drawing any conclusion.
In its free 2019 Water-Cooled Servers white paper, ASHRAE Technical Committee 9.9 describes controlling technology-loop supply temperature to at least 2°C (3.6°F) above measured room-air dew point as a buffer against condensation and some measurement uncertainty. The paper also discusses alarms when the supply temperature approaches that buffer. The exact approved limits, margins and equipment actions for a real installation come from its engineering design and equipment manufacturer, not from an educational example.
The Open Compute Project Advanced Cooling Facilities reference guidance similarly notes that a CDU can maintain TCS temperatures above dew point. OCP also identifies transitions and maintenance periods as reasons to consider condensation alarms sent to facility monitoring. A lower coolant setpoint may improve thermal performance in one subsystem while raising the possibility of moisture formation in a humid space. The risk must be managed as a system rather than optimizing a single temperature number.
Open Compute Project educational presentation, “Liquid Cooling Controls — Presented by Vertiv,” published October 21, 2024. Matt Keller discusses cooling loops, sensors, warning data and controls for direct-to-chip systems. The source is an openly accessible OCP technical presentation, not a verified test of the installation discussed in this lesson.
Two Different Margins Must Not Be Confused
The thermodynamic condensation margin is the measured exposed surface temperature minus local air dew point. It is positive when the monitored surface is warmer than dew point and negative when colder. The engineering screening margin is often the technology-loop supply temperature minus (dew point + the required buffer). A 2°C buffer is a conservative reference from ASHRAE guidance for defined systems; it is not proof that liquid water exists whenever the margin falls below that target.
For example, a 17°C pipe and a 15.9°C dew point are separated by about 1.1°C. Such a pipe is above the nominal condensation threshold, but does not satisfy a 2°C buffer. An alert in that condition warrants investigation and corrective decisions under the local approved procedure. A second example, a pipe at 15°C in the same air, is below dew point and supports a more immediate moisture-risk assessment. No worker should wait for visible water before following a documented alarm escalation.
A NOAA-Based Dew-Point Calculation
The following published NOAA NDBC vapor-pressure relationship is suitable for a reproducible classroom illustration. The handbook uses air temperature T in °C and relative humidity RH in percent. The expression is an approximation, and different industrial instruments may use other validated humidity conversions or calibration corrections.
T_K = T_C + 273.15
e_s = exp(-5438 / T_K + 21.72)
e = (RH / 100) * e_s
T_dew_C = -5438 / (ln(e) - 21.72) - 273.15

Condensation margin (°C) = exposed surface temperature - T_dew_C
2°C screening margin = TCS supply temperature - (T_dew_C + 2°C)
Assume a fictional room-air sensor reads 24.0°C and 60% RH. Applying the equation gives a calculated dew point of approximately 15.93°C. If a TCS supply sensor reads 20.0°C, the temperature above dew point is 20.0 − 15.93 = 4.07°C; its buffer-relative margin is 20.0 − (15.93 + 2.00) = +2.07°C. Under the assumptions and with suitable sensor locations, the 20.0°C reading passes the 2°C classroom screening test.
If the same hypothetical coolant sensor instead reports 17.0°C, the margin above dew point is only 1.07°C; the buffer-relative margin becomes −0.93°C. The reading fails that screening threshold even though the sensor’s temperature has not yet fallen below calculated dew point. Differentiating loss of design margin from observed condensation is an essential diagnostic skill.
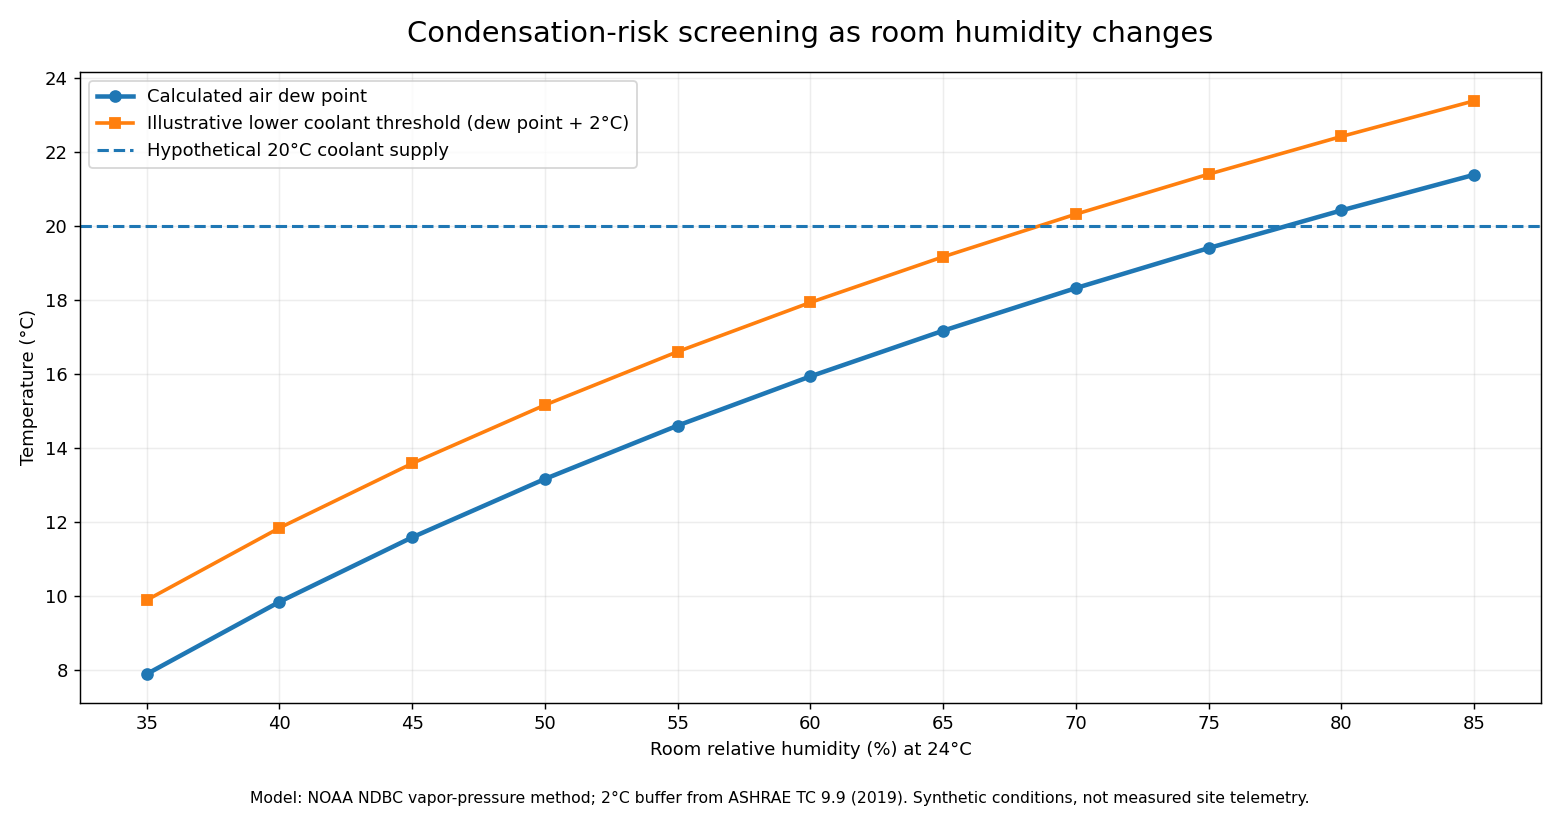
The original chart holds air temperature constant at 24°C while RH rises from 35% to 85%. Calculated dew point rises from approximately 7.88°C to 21.38°C. A hypothetical 20°C coolant supply clears the ASHRAE-style 2°C margin at some humidity levels but fails at higher humidity. At 80% RH the modelled dew point is about 20.42°C, greater than the assumed supply temperature itself. Actual conditions require measurements at the relevant rack and surface location; the chart is not a commissioning acceptance test.
Where Technicians Should Look for Evidence
- Rack and room conditions: identify the air-temperature and RH probe’s exact position, height, calibration age and whether the reading represents the monitored cooling surface.
- Coolant loop: compare TCS supply/return temperature, the FWS supply/return channels and any active CDU dew-point protection state; note that loop temperature and pipe-wall temperature may differ.
- Exposed components: inspect only approved, safely accessible hose runs, valves, fittings, manifolds, quick-disconnect interfaces and cold surfaces where local air might reach them.
- Transient operations: note startup, maintenance, setpoint transitions, chilled-water changes and humidity excursions, because a steady-state average may hide the most hazardous condition.
- Instrumentation: investigate invalid sensor inputs, implausible values, timestamp gaps, stuck telemetry, wrong units or a sensor assigned to the wrong rack.
- Facility actions: correlate BMS and CDU alarms with environmental readings, leak detection, server thermal alerts and recorded operational changes.
ASHRAE’s data-center recommendations emphasize granular rack-inlet sensing rather than relying entirely on remote room-average sensors. The ASHRAE AI Data Center Energy Performance Framework also describes monitoring and thermal management as coupled tasks. An inlet probe, a room average and a sensor in a sealed cold aisle may each report different conditions; a record should preserve the measurement locations rather than averaging them without explanation.
How to Investigate Alarms Without Changing Live Cooling
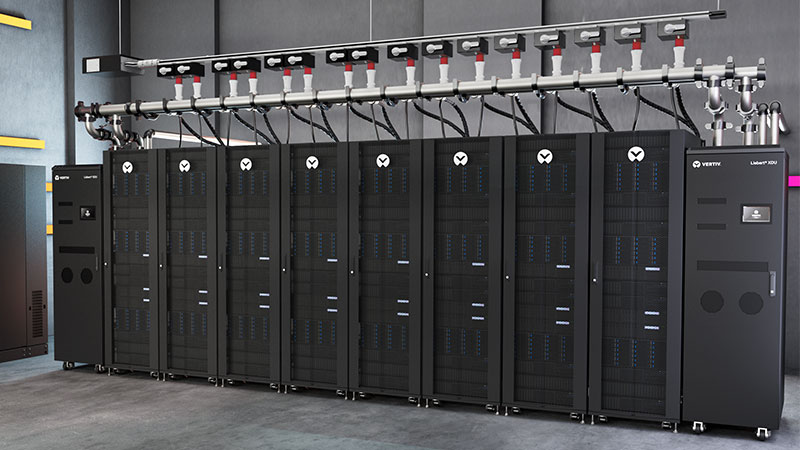
Technicians working in an occupied datacenter should begin with monitoring data and approved visual evidence. Condensation alerts may be caused by genuinely rising humidity, loss of dew-point margin, damaged insulation, unusual chilled-water temperature, or a faulty measurement. A BMS alarm is not itself proof that the CDU has failed. Conversely, a safe average TCS supply temperature is not proof that a local uninsulated valve or fitting cannot be colder.
- Identify the event: capture alarm name, asset ID, time zone, first occurrence, affected rack or loop, and the monitoring system from which the event originated.
- Confirm units: distinguish °C from °F, RH percent from dew point, and TCS from FWS. A mislabeled probe can make a healthy system appear to violate a threshold.
- Review simultaneous readings: plot air temperature, RH, calculated or measured dew point, TCS supply and any approved surface-temperature channels over the same time axis.
- Check historical normal: compare with an appropriate baseline during similar IT load, occupancy and control configurations. Document whether the excursion was sudden or gradual.
- Record physical observations: approved external photographs of visible droplets or staining may support escalation, but do not touch or disconnect energized cooling hardware.
- Escalate according to site policy: facility operators and qualified engineers determine corrective responses to cooling, humidity, controls and equipment. Technicians should not silently override CDU setpoints, leak interlocks or alarm functions.
The earlier OSDCTC.011 change-control lesson explains why an operational observation and an authorized change request are different. A cooling investigation should preserve that separation. Even if a lower temperature seems to improve processor cooling, changing a live system without equipment-owner authorization can affect thermal limits, condensation protection and service availability.
Equipment-Specific Control and Open Industry Guidance
The Open Compute Project Cold Plate sub-project publishes open technical resources on coolant fluids, connectors, cold plates, manifolds, CDUs and serviceability. OCP guidance supports consistent vocabulary and helps engineers identify risks during design and maintenance. Those community documents are not an instruction to substitute unapproved water chemistry, hoses or fittings on a specific installed platform.
Some CDUs can influence secondary coolant temperature with bypass valves, pump control or other control strategies. Real operating limits depend on the coolant chemistry, cold plate, hydraulic pressure, equipment specifications and local dew-point protection logic. A technician should record the current settings and applicable manufacturer alarm state rather than changing values to recreate a classroom scenario.
Open Compute Project open educational presentation, “Accelerating Liquid Cooling Adoption: CDU Efficiency, Faster Deployments, and Smarter Site Prep,” published June 19, 2026; Bob DeHoff of Boyd discusses CDU architecture, site requirements and deployment planning. Product claims in the presentation require their own validation and are not used as measured data for the worked calculation.
Documentation-Only Practical Lab
Create a spreadsheet with fictional data at 24°C room temperature and RH readings of 35%, 40%, 45%, 50%, 55%, 60%, 65%, 70%, 75%, 80% and 85%. Use the NOAA-derived equations to calculate a dew point for each row and add 2°C to establish a reference lower-bound temperature. Enter a constant 20°C hypothetical TCS supply reading as a separate column. Calculate 20°C minus the dew point, then 20°C minus (dew point + 2°C). Indicate whether the modeled temperature passes or fails the 2°C screening buffer, clearly labelling the results hypothetical.
Sample check: at 24°C and 60% RH, the expected dew point is 15.93°C, and the screening threshold is 17.93°C. At 80% RH, the expected dew point is about 20.42°C, so the hypothetical 20°C supply is already below the modeled dew point. The lab exercises quantitative recognition; it neither validates a physical sensor nor determines an approved operating setpoint for any equipment.
Add two quality-control columns for sensor location and timestamp. Explain why pairing an RH sensor from one room with a coolant sensor from another equipment row could yield an invalid risk judgment even when the arithmetic is correct. Finish with a service ticket draft containing the readings, the formula/source, the assumptions, the alert classification and the party authorized to act.
Common Faults, Misinterpretations and Safety Limits
- Relative humidity treated as temperature: an RH number is not a dew-point reading, and a 60% RH alarm alone cannot determine condensation risk.
- Supply water confused with exposed surface: coolant temperature can differ from fittings, hoses, insulated areas and cold-plate metal.
- Temperature averaging: a site-wide average may hide moisture conditions near a particular rack or under a localized airflow arrangement.
- Buffer confused with condensation: a reading inside the 2°C buffer requires escalation under the applicable policy, but is not proof that water has already condensed.
- Dry sensor assumed trustworthy: calibration, response delay, drift and device fault codes can invalidate a plausible-looking value.
- Unreviewed control override: altering a chiller, CDU or humidification setpoint can expose other racks to thermal or moisture problems.
- Liquid leak misidentified: a coolant leak and atmospheric condensation are separate failure mechanisms; neither is safely diagnosed from one humidity reading alone.
Neither dew-point monitoring nor a dry-looking rack eliminates liquid leak risk. Preserve leak-detector and CDU alarms separately and follow OSDCTC.016’s monitoring principles. All electrical or coolant-side inspection, disassembly, pressure testing, fluid handling, and fault correction should be performed only by qualified staff under the organization’s approved lockout, spill response, change-control and vendor service requirements.
Knowledge Check With Explained Answers
- What determines condensation risk at an exposed surface? Whether its temperature is at or below the dew-point temperature of air reaching that surface, subject to local transfer conditions.
- Can 60% RH alone establish dew point? No. The air temperature and the humidity relationship are required; validated sensors may calculate the result internally.
- What is the approximate dew point at 24°C and 60% RH using the NOAA educational method? 15.93°C.
- What is a 2°C threshold for that example? 15.93 + 2 = 17.93°C, under the ASHRAE-style classroom screening reference.
- Does a 17°C coolant sensor prove condensation in that example? No. Its nominal reading is 1.07°C above dew point, but it falls short of the 2°C buffer and warrants escalation under the local policy.
- Why distinguish FWS and TCS sensors? A heat exchanger can separate facility cooling water from IT-side coolant, with different temperatures, conditions and acceptable limits.
- What should a technician do when the environmental sensor appears faulty? Preserve alarm evidence and escalate for qualified validation rather than treating a questionable value as authoritative.
- Does a modelled plot represent actual data-center telemetry? No. Every plotted value in the lesson was calculated from hypothetical conditions; actual operations need real sensor data and certified equipment requirements.
Primary Educational References
ASHRAE TC 9.9, Water-Cooled Servers: Common Designs, Components, and Processes (2019); Open Compute Project, ACF Reference Design Guidance and Cold Plate open community resources; NOAA NDBC, Handbook of Automated Data Quality Control, dew-point conversion appendix; ASHRAE, Energy and Thermal Efficiency recommendations; and the linked Open Compute Project training videos. Consult the installed system’s current engineering instructions for binding limits, sensor accuracy, response procedures and equipment suitability.
Summary
Condensation prevention is not merely a question of keeping liquid-cooling hardware cold enough for processors. Safe monitoring compares the right air and cooling measurements at the right locations and times. Dew-point calculations identify potential risk; engineering buffers provide earlier warnings; and qualified operators determine the response. A disciplined technician records the measurements, uncertainty and evidence before recommending action.
Editor’s Note: OSDCTC.017 follows the verified OSDCTC.016 lesson. The worked values were calculated from the NOAA NDBC published vapor-pressure relationship and a 2°C ASHRAE reference buffer; no humidity or coolant instruments were tested. The 1200 × 630 featured cover is original AI-generated conceptual editorial imagery, not a real facility photograph. The two in-body equipment photographs originate from Vertiv manufacturer material; the original chart contains hypothetical, not measured, values. The Open Compute Project videos are educational presentations. Gutenberg iframe presence and live playback are evaluated separately. No custom conceptual schematic or diagram was created.

For mobile scanning, display the lesson on a computer or another screen and scan the original QR with a compatible Bitcoin wallet. Some wallets can import a saved QR image from the same phone. Confirm the displayed recipient and 5,000-satoshi amount before submitting payment.
We volunteer daily to ensure the information on this platform is Verifiably True. If you would like to support the research, please scan the QR code.
BitcoinVersus.Tech is not a financial advisor. Educational reporting does not replace site-specific electrical, equipment safety or engineering instructions.


Leave a Reply