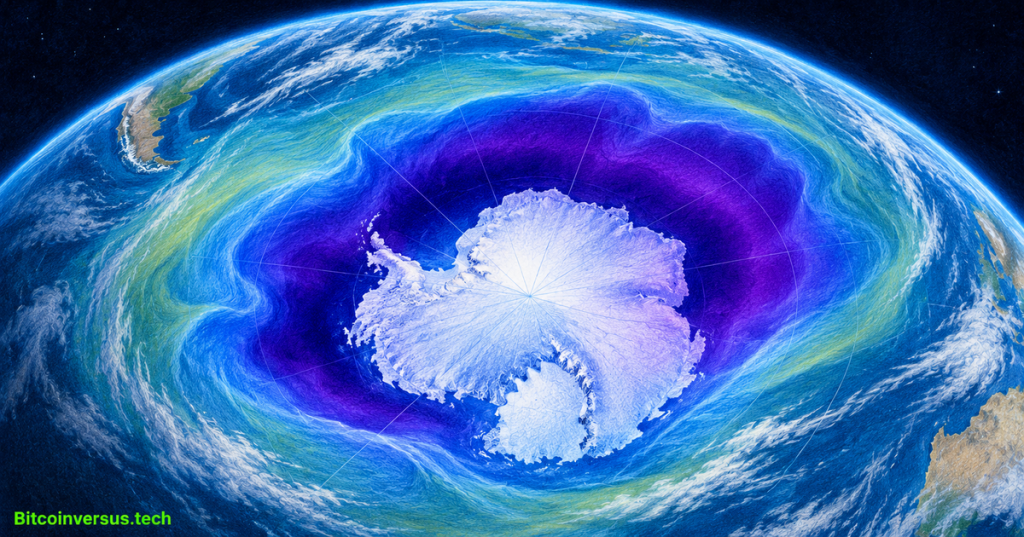
The Antarctic ozone hole ranked seventh largest in 48 years of monitoring in 2026, according to a November 4 report from NASA and NOAA. Yet scientists say long-term recovery continues. A powerful polar vortex expanded the region of depleted ozone, while decades of restrictions on ozone-destroying chemicals limited how severe the depletion became.
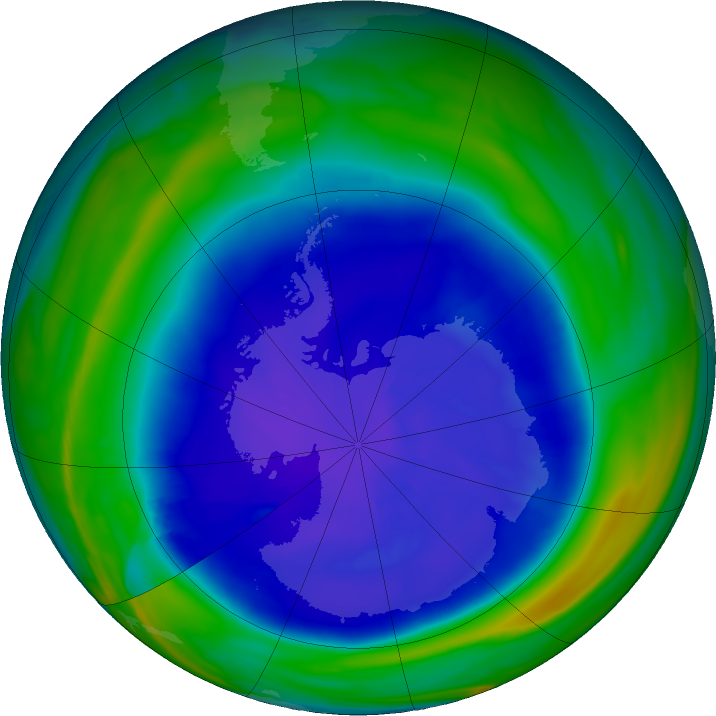
The ozone layer is a region of the stratosphere that absorbs much of the Sun’s biologically harmful ultraviolet radiation. Researchers define the Antarctic “ozone hole” as the region south of 40°S where the total atmospheric ozone column falls below 220 Dobson units. It is not a literal gap in the atmosphere, and the measure differs from ground-level ozone pollution.
An official 2026 animation shows the hole growing
NASA and NOAA’s official “2026 Ozone Hole Update,” released November 4, 2026, explains the season’s Antarctic ozone depletion and the monitoring methods. Credit: NASA Goddard Space Flight Center, official YouTube channel.
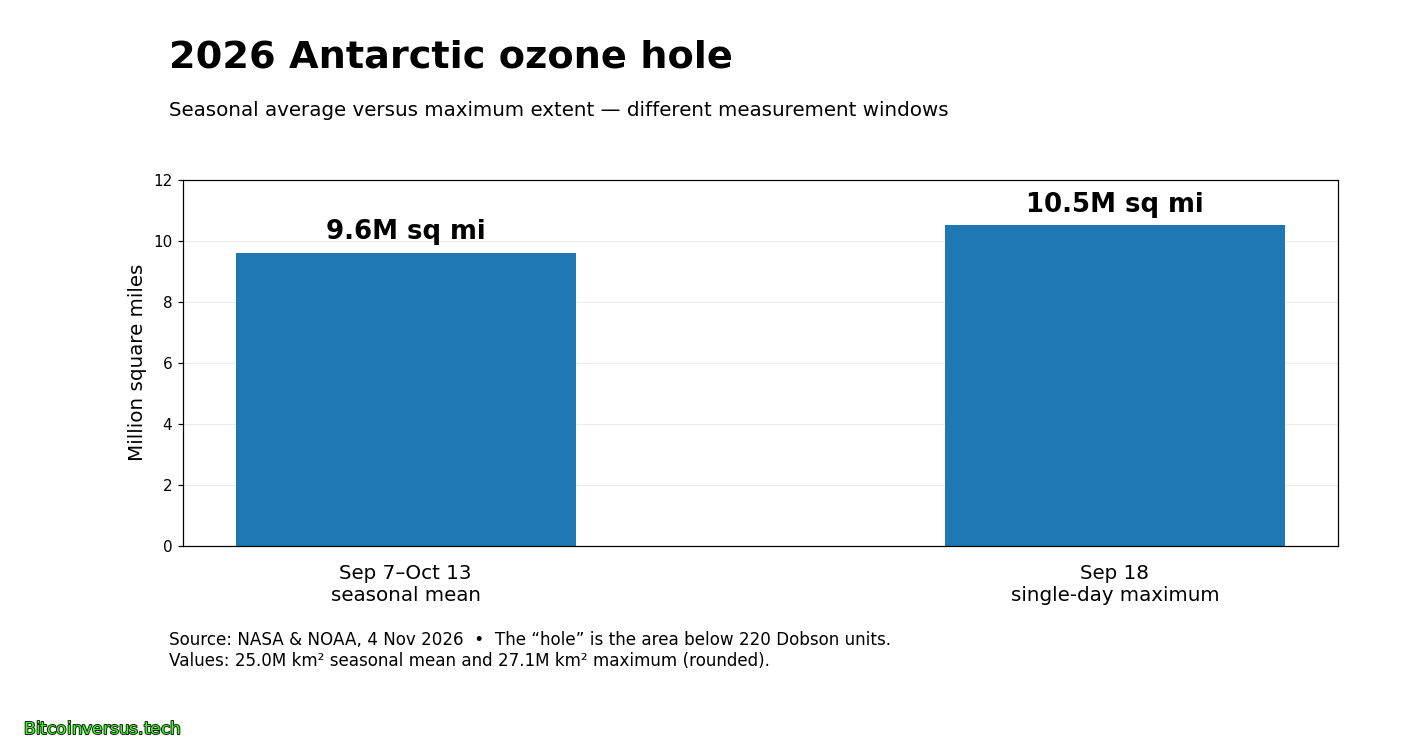
From September 7 to October 13, NASA and NOAA measured a seasonal mean depleted area of 9.6 million square miles (25 million km²). The annual single-day maximum reached 10.5 million square miles (27.1 million km²) on September 18. The maximum exceeded the seasonal mean by 0.9 million square miles, about 9.4%. Those figures describe different measurement windows within 2026, not a year-over-year growth rate.
Why a larger hole does not mean recovery failed
The Antarctic winter polar vortex isolates a mass of cold stratospheric air. Polar stratospheric clouds help convert chlorine- and bromine-bearing compounds into reactive forms that destroy ozone when spring sunlight returns. NOAA researcher Amy Butler attributed the large 2026 vortex partly to weak planetary-scale atmospheric waves during August and September. Similar atmospheric dynamics underpin the site’s earlier coverage of the physics of major storm systems, although a stratospheric polar vortex is not a tornado or hurricane.
NOAA measured a minimum of 105 Dobson units directly over the South Pole on October 17, compared with the historical South Pole low of 92 units in October 2006. A wide depleted area and a low central ozone concentration are separate statistics: the seventh-largest area was not the deepest recorded ozone loss.
Satellites and balloons measure different parts of the problem
Satellite instruments aboard NASA’s Aura and the NOAA-20, NOAA-21 and Suomi NPP spacecraft helped track the ozone field across Antarctica. A different form of Earth-observation satellite imaging records surface changes rather than stratospheric chemistry. Meanwhile, NOAA ozonesondes launched on balloons measure vertical ozone profiles directly. Balloon-based environmental monitoring also appears in coverage of the Air Force’s WindBorne weather-data purchase, though the missions use different instruments.
Both ground and space systems matter because a satellite map alone does not provide the same local vertical profile as a sonde. Maintaining observation programs across decades also depends on spacecraft lifetimes; a separate report documented NASA’s recently ended Swift satellite mission, which studied high-energy astrophysics rather than Earth’s ozone.
Chemical controls remain the longer-term test
The 1987 Montreal Protocol phased down ozone-depleting substances. NOAA estimates that chlorine attributable to controlled chemicals in the Antarctic stratosphere has declined by roughly one-third from its earlier peak. NASA scientist Paul Newman estimated that, with the chemical burden present around 2000, the 2026 hole might have been 1 million to 2 million square miles larger. That scenario is an expert counterfactual, not an observed extra area.
Scientists currently project Antarctic ozone recovery toward the 2070s, dependent on continued progress and atmospheric conditions. A single large vortex-driven season does not erase the chemical trend, but neither does the long-term projection guarantee a small ozone hole every year.
Sources and methodology
Primary sources: NOAA news release, November 4, 2026; NASA’s 2026 ozone assessment; NASA Goddard official video and credits; NASA Ozone Watch September 18 map; NASA Ozone Watch monitoring. Percentage calculation: (10.5 − 9.6) ÷ 9.6 × 100 ≈ 9.4%, using rounded published U.S. customary area units. Seasonal mean, peak area, and point minimum are distinct measures.
Editor’s Note: NASA/NOAA measurements are observational results through the stated reporting dates; estimated effects of earlier chemical concentrations and the 2070s recovery horizon are projections. The branded 1200 × 630 featured cover is a conceptual illustration, not a measured map. The separately credited NASA Ozone Watch map shows authentic measurements for September 18. Video and imagery are credited to their source organizations.
Support BitcoinVersus.Tech
For an optional 5,000-satoshi contribution, scan the approved BitcoinVersus.Tech QR image using a compatible Bitcoin wallet. Verify the destination and amount before making a payment.

We volunteer daily to ensure the information on this platform is Verifiably True. If you would like to support the research, please scan QR code.
NASA and NOAA satellite, field and model findings are reported for educational and scientific purposes. No medical risk prediction for a particular location is implied by Antarctic ozone-hole area measurements.


Leave a Reply