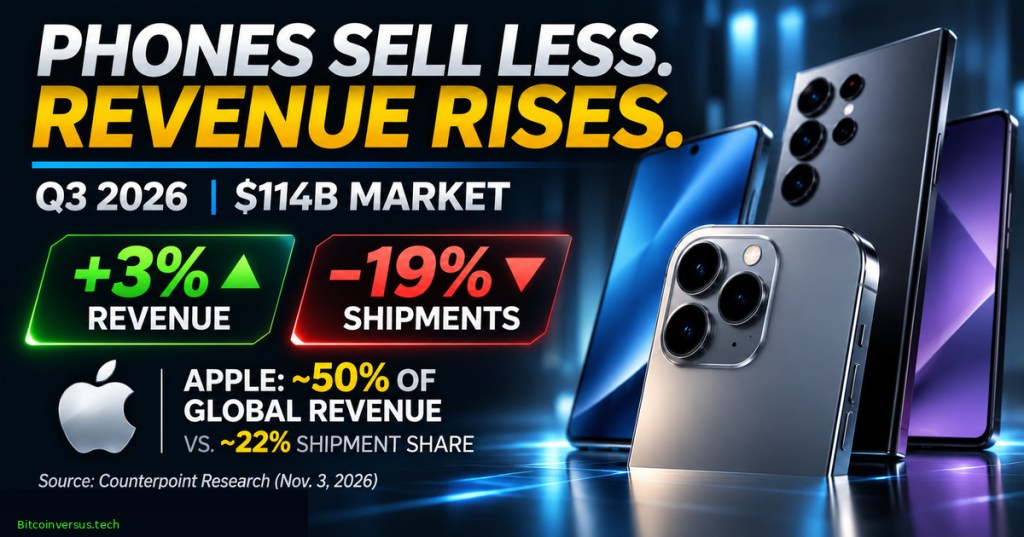
Smartphones depend on two major memory technologies: DRAM, which stores working data for applications, and NAND flash, which retains operating systems, photos and files. Rising component costs can make inexpensive handsets harder to manufacture profitably, pushing vendors toward more expensive models even when fewer devices ship. That change has produced a striking split between global phone sales volume and the industry’s dollar revenue.
Worldwide smartphone revenue reached an estimated $114 billion in the third calendar quarter of 2026, up 3% year over year, despite a 19% decline in shipments, according to Counterpoint Research’s November 3 Market Monitor report. The global wholesale average selling price (ASP) climbed 27% to $442. The estimates are preliminary and describe industry handset revenue, not revenue from apps, services or accessories.
Apple’s official September 9, 2026 launch keynote introduces iPhone 18 Pro and the foldable iPhone Duo. The presentation illustrates premium model positioning; worldwide revenue and shipment figures come from Counterpoint Research’s November 3 Market Monitor, not Apple’s promotional video. Credit: Apple / YouTube.
Higher selling prices offset fewer devices
The arithmetic helps explain the divergence. Using index values, a 19% shipment decline leaves 81% of the previous year’s volume. Multiplying by the new price factor of 1.27 yields 1.0287, or approximately 2.9% revenue growth, consistent with Counterpoint’s rounded 3%. Actual brand mix and wholesale prices vary, so the calculation is a market-level illustration rather than a breakdown of individual purchases.
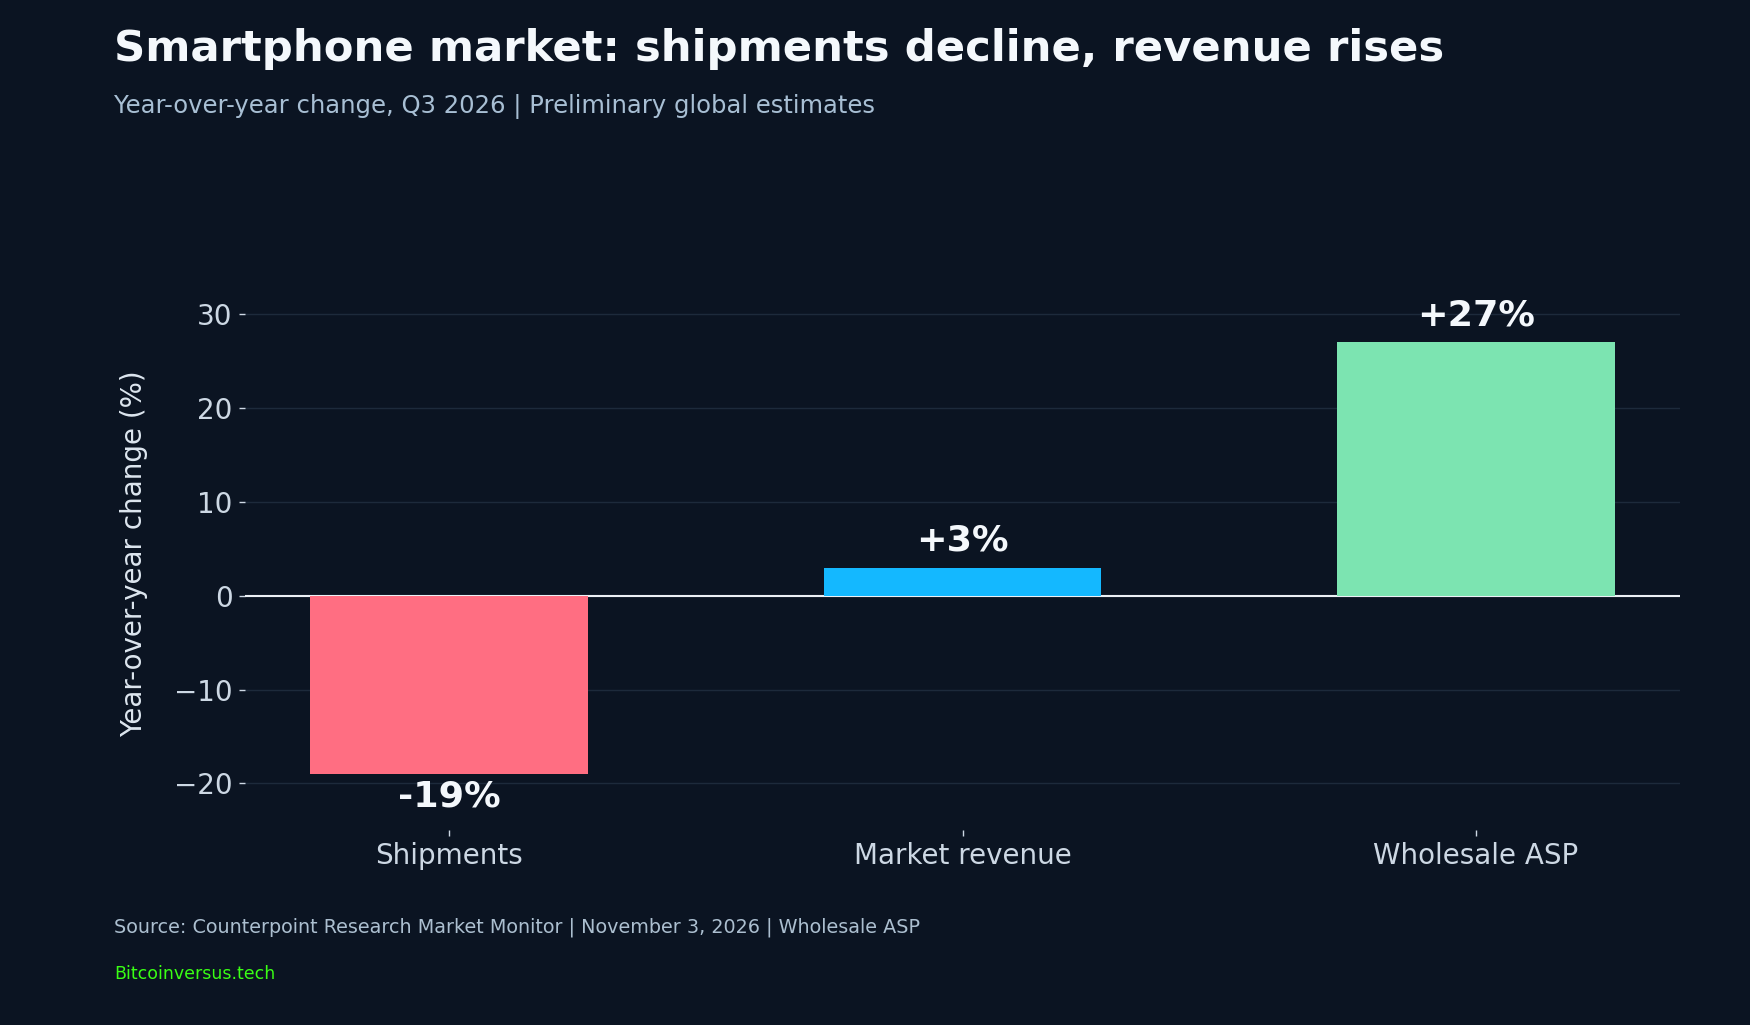
The new revenue comparison adds a missing dimension to earlier BitcoinVersus.Tech coverage of falling shipments. IDC estimated a 22% quarterly unit decline, while Counterpoint’s revised revenue study reports 19% and Omdia separately estimated 20%. Different firms and revision schedules produce different shipment estimates; their figures should not be combined to calculate a single exact market total.
Apple takes half of handset revenue, not half of units
Counterpoint estimates Apple captured 50% of worldwide smartphone revenue, compared with approximately 22% of shipments. Samsung held 19% of revenue and approximately 22% of shipments. Revenue share counts wholesale dollars, while shipment share counts devices delivered into channels. Apple’s dollar share therefore does not mean one in two smartphones was an iPhone.
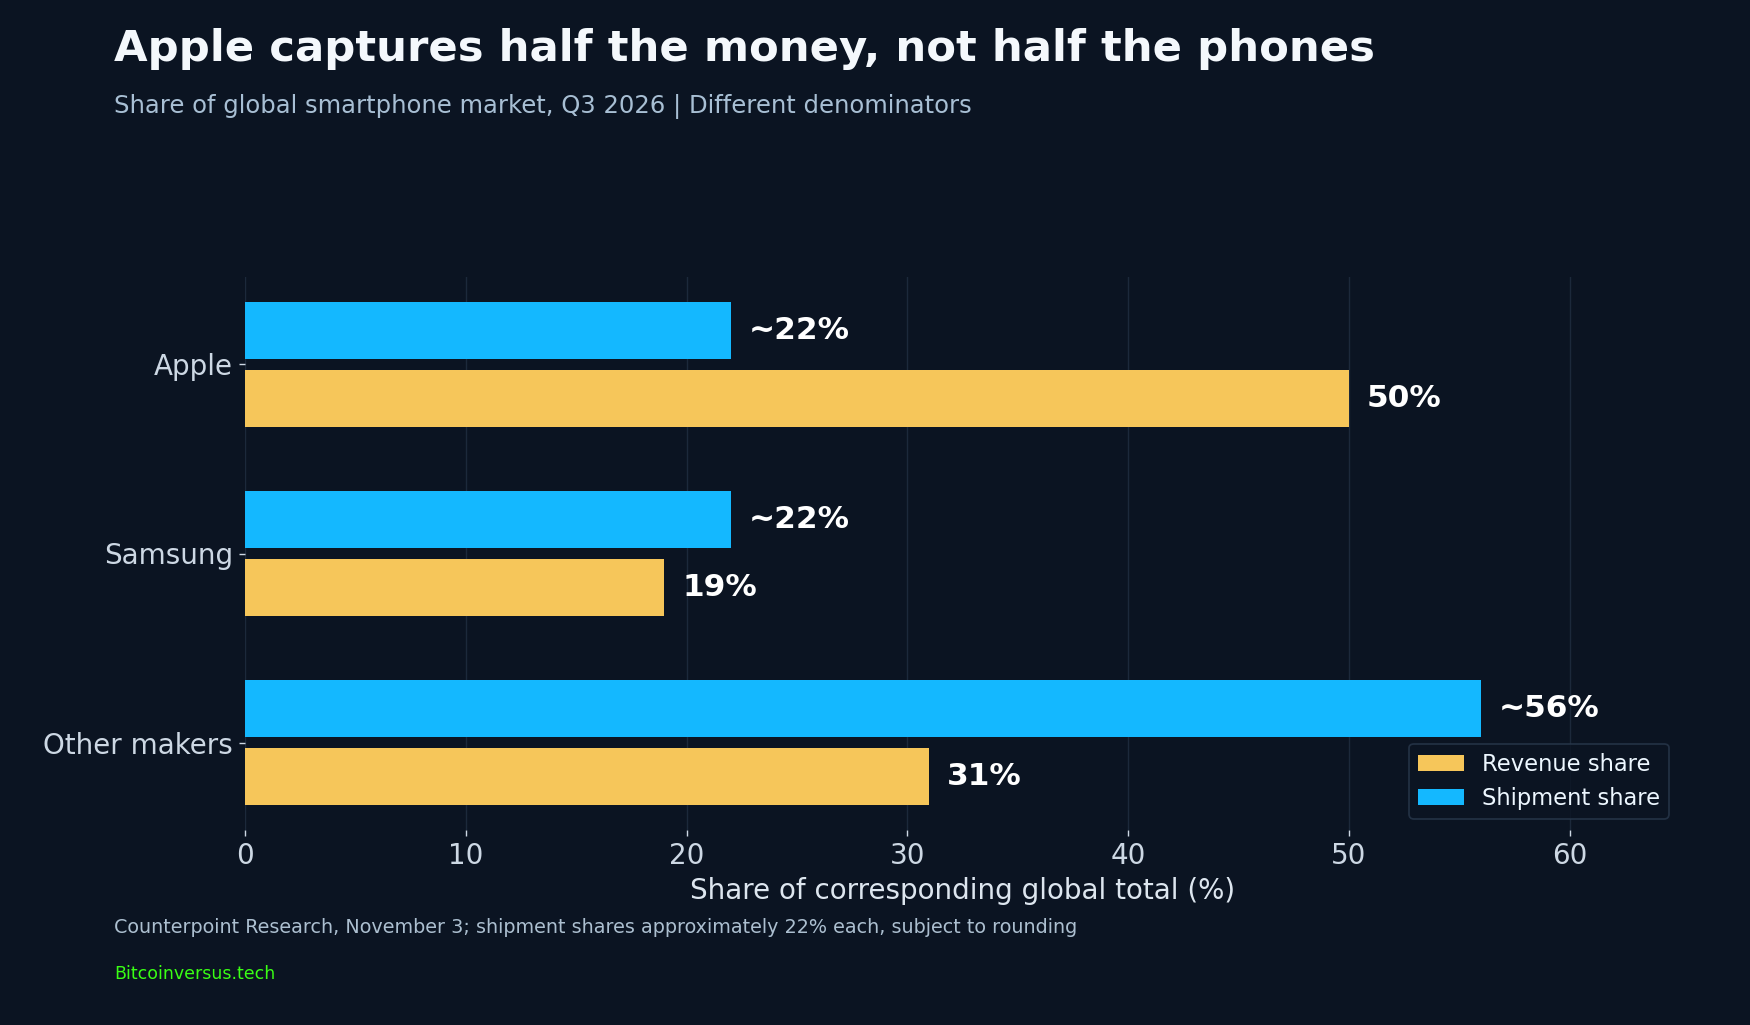
Applying Apple’s rounded 50% share to the rounded $114 billion market implies roughly $57 billion of global iPhone wholesale revenue, not a separately audited company result. Apple’s own November 2 financial report recorded $114.5 billion in total company revenue across all product and service lines. The similar $114 billion figures have different scopes and must not be confused.
Apple’s iPhone 18 Pro launch, powered by the A20 Pro semiconductor platform, and its first foldable iPhone Duo illustrate premium positioning. Counterpoint attributed Apple’s 17% handset revenue increase partly to more expensive models and higher selling prices, not an industry-wide recovery in unit demand.
A market split between premium and budget brands
Counterpoint reported Samsung smartphone revenue increased 14% with a 21% increase in its ASP to $367. Xiaomi’s revenue was broadly unchanged, while OPPO and vivo revenue declined 26% and 22%, respectively. The figures show that price increases do not guarantee higher sales value when shipment volumes contract sharply.
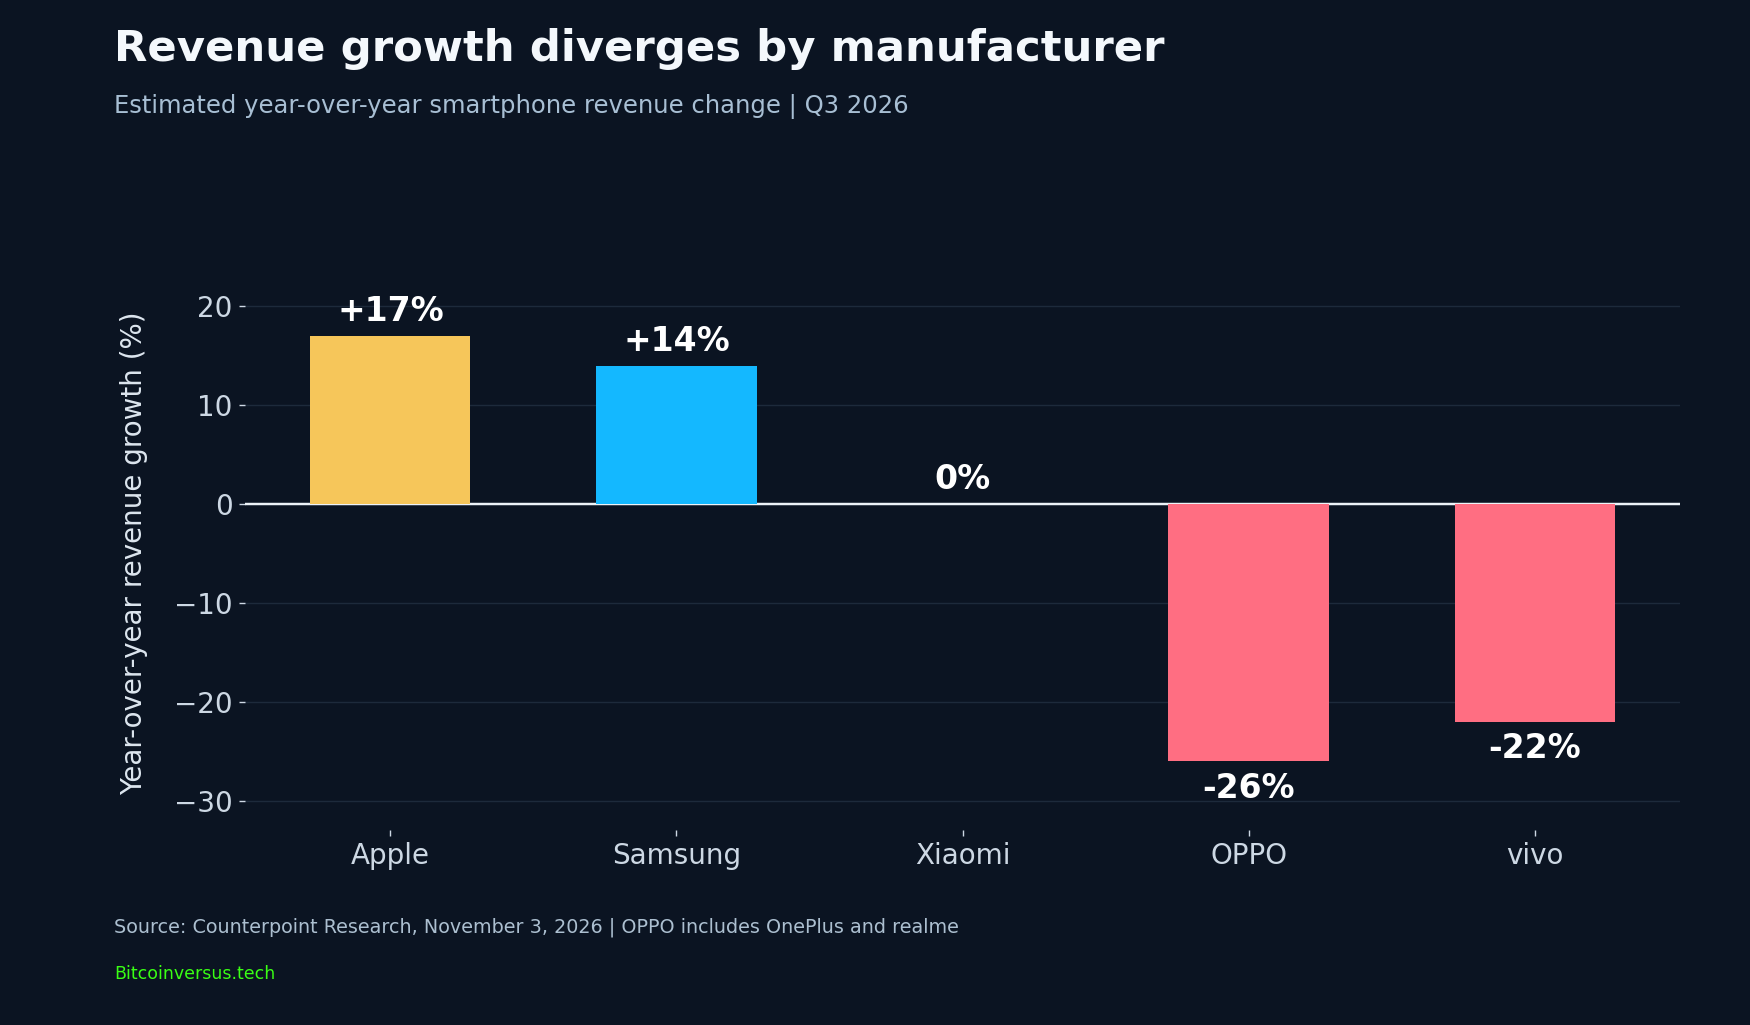
The memory shortage intersects with demand for RAM in AI infrastructure, raising costs for manufacturers dependent on affordable DRAM and storage. Firms able to sell premium hardware have more room to absorb costs or raise prices; buyers in lower-income markets face delayed upgrades and reduced product choice.
Revenue is not the same as profit. Higher memory costs, inventory risks, currency effects and promotional spending can reduce margins even as average selling prices rise. Counterpoint expects additional shipment pressure into 2027 and meaningful component-cost relief no earlier than 2028, a forecast rather than an observed result.
The new figures define the industry’s central tension: manufacturers can collect more wholesale revenue by selling fewer, more expensive phones, but declining access to affordable devices may undermine future growth. The next quarterly test will be whether premium demand stays resilient as price increases reach more of the market.
Primary reporting: Counterpoint Research, November 3, 2026; Counterpoint shipment update, October 12; Omdia, October 29; Apple fiscal results, November 2. Video: Apple’s verified official September 9 product keynote.
Editor’s Note: Smartphone market revenue, shipments, ASP and manufacturer shares are preliminary Counterpoint Research estimates. Wholesale ASP is not a retail checkout price. Shipment figures from competing research firms and revision dates are distinguished, not pooled. Percentage calculations use rounded public rates and may differ from unrounded underlying research. The featured cover is a conceptual illustration, not a documentary product photo. The three charts are original visualizations of the cited data; the official Apple video documents product introductions rather than the market figures. No independent audit of proprietary shipment datasets was performed.
Support BitcoinVersus.Tech
To support independent technology reporting, scan the original donation QR below for an optional 5,000-satoshi contribution. On a phone, display the code on another screen and scan with a compatible Bitcoin wallet, or import the saved QR image if supported. Verify the destination and amount before confirming payment.

We volunteer daily to ensure the information on this platform is Verifiably True. If you would like to support the research, please scan QR code.


Leave a Reply