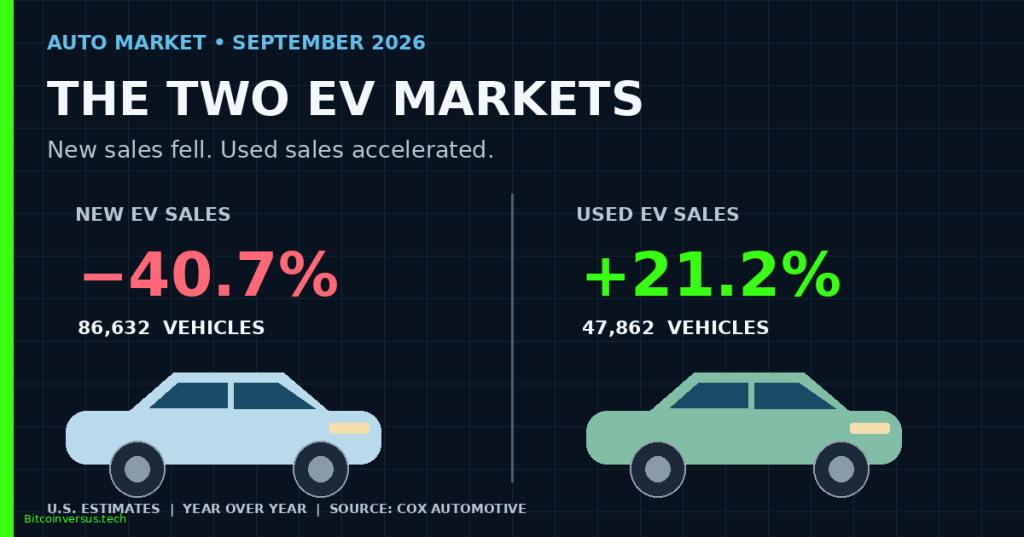
An electric vehicle can be sold twice without being manufactured twice. The new-car market depends on automakers building and delivering vehicles, while the used-car market depends on existing EVs returning through trade-ins, leases and resale. Those distinct supply chains help explain a widening split in U.S. electric-vehicle sales, where secondhand demand is growing even as purchases of newly built models remain well below last year’s elevated level.
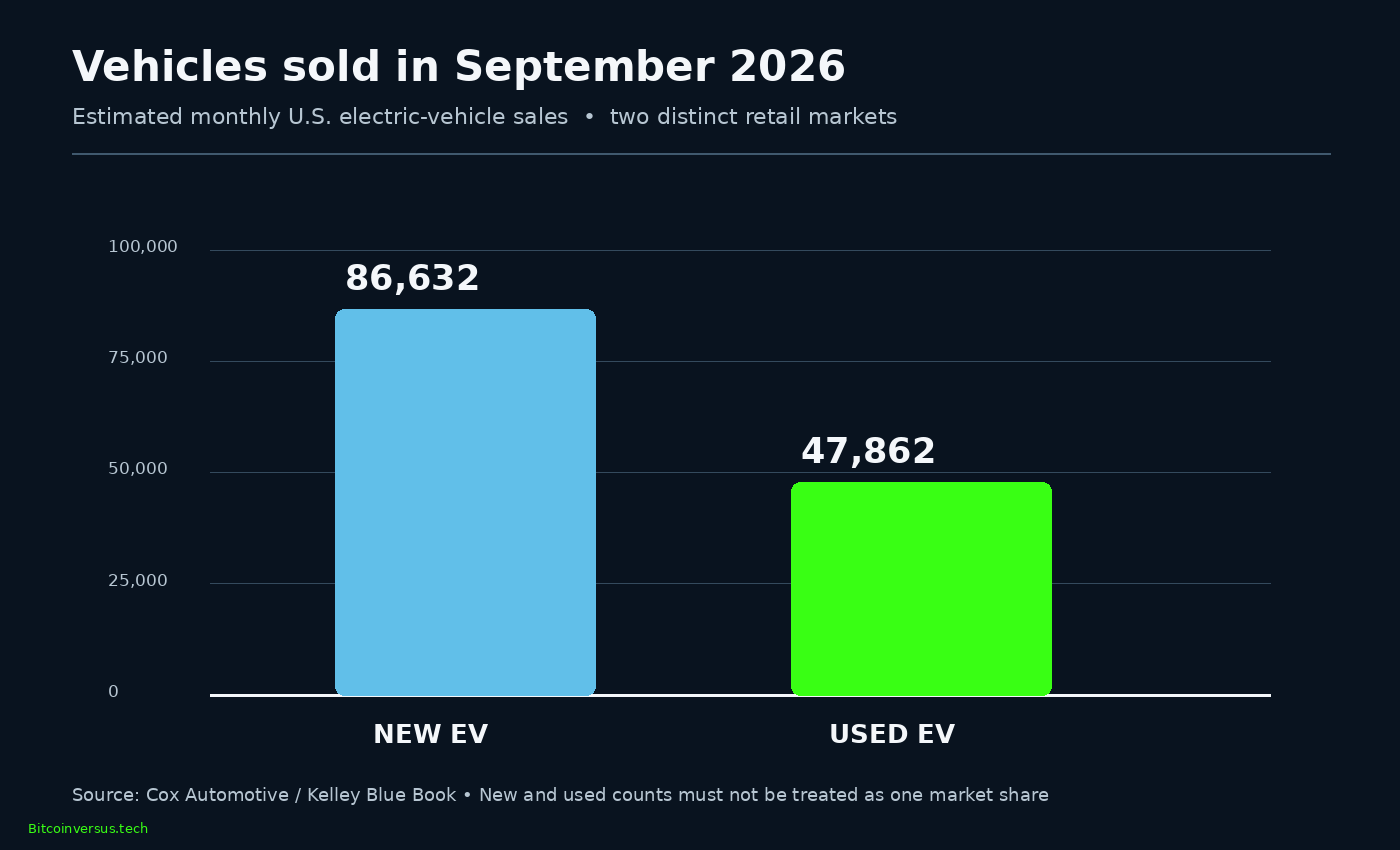
Cox Automotive’s October 16, 2026 EV Market Monitor estimates 47,862 used EVs sold in September, an increase of 21.2% year over year. New EV sales moved the opposite direction: 86,632 vehicles, down 40.7% from September 2025. The contrast measures two separate retail markets, not a verified migration of the same buyers from new to used vehicles.
Kelley Blue Book senior editor Lauren Swift explains EV ownership and charging in an official August 31, 2026 video. The explainer predates September’s sales statistics; it is technical background rather than evidence of the reported monthly totals. Source: Kelley Blue Book / YouTube.
A record used-EV share meets a difficult comparison year
Used EVs represented a record 3.3% of U.S. used-vehicle sales, up from 2.9% in August. New EVs held 6.5% of the separate new-vehicle market, up from 6.3% a month earlier despite a slight monthly decline in sales volume. The percentages have different denominators and should not be subtracted to estimate a single national EV market share.
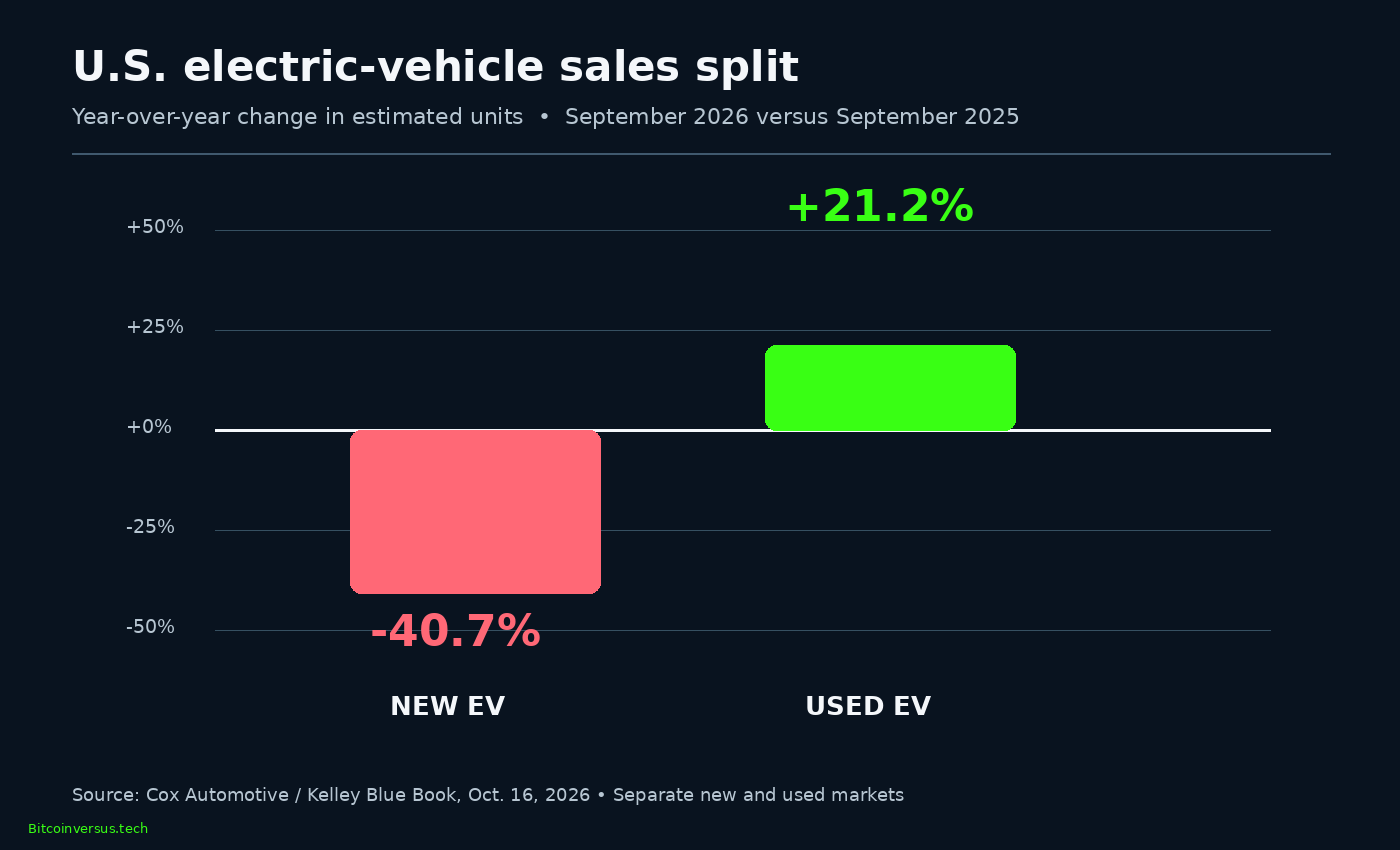
The steep new-EV decline needs historical context. Cox recorded 146,076 new EV sales in September 2025, when buyers were approaching the expiration of federal purchase incentives. By September 2026, new-EV sales were only 0.8% below August, a much smaller sequential change. A dramatic year-over-year decline therefore does not establish a comparable one-month collapse. The broader U.S. hybrid-versus-battery-EV sales comparison provides context across competing vehicle types.
New cars still lead in absolute EV transactions
The two September estimates show new EV sales exceeding used EV sales by 38,770 units. Used-EV transactions were approximately 55.2% of new-EV sales volume, calculated as 47,862 divided by 86,632. The ratio compares two separate sales channels; it is not the used-EV share of all electric vehicles in circulation. Used EVs nevertheless expanded their share of the larger secondhand market.
Affordability helps explain interest, but prices require careful comparison. A new EV’s average transaction price was $55,842; a used EV’s average listing price was $36,767. Transaction and advertised listing prices are not equivalent paid-price measures. Used-EV asking prices declined 1.8% from August but remained 6.4% above September 2025. The average used-EV listing premium over non-BEV vehicles narrowed from $2,692 to $2,137 month over month.
Inventory tells a second story
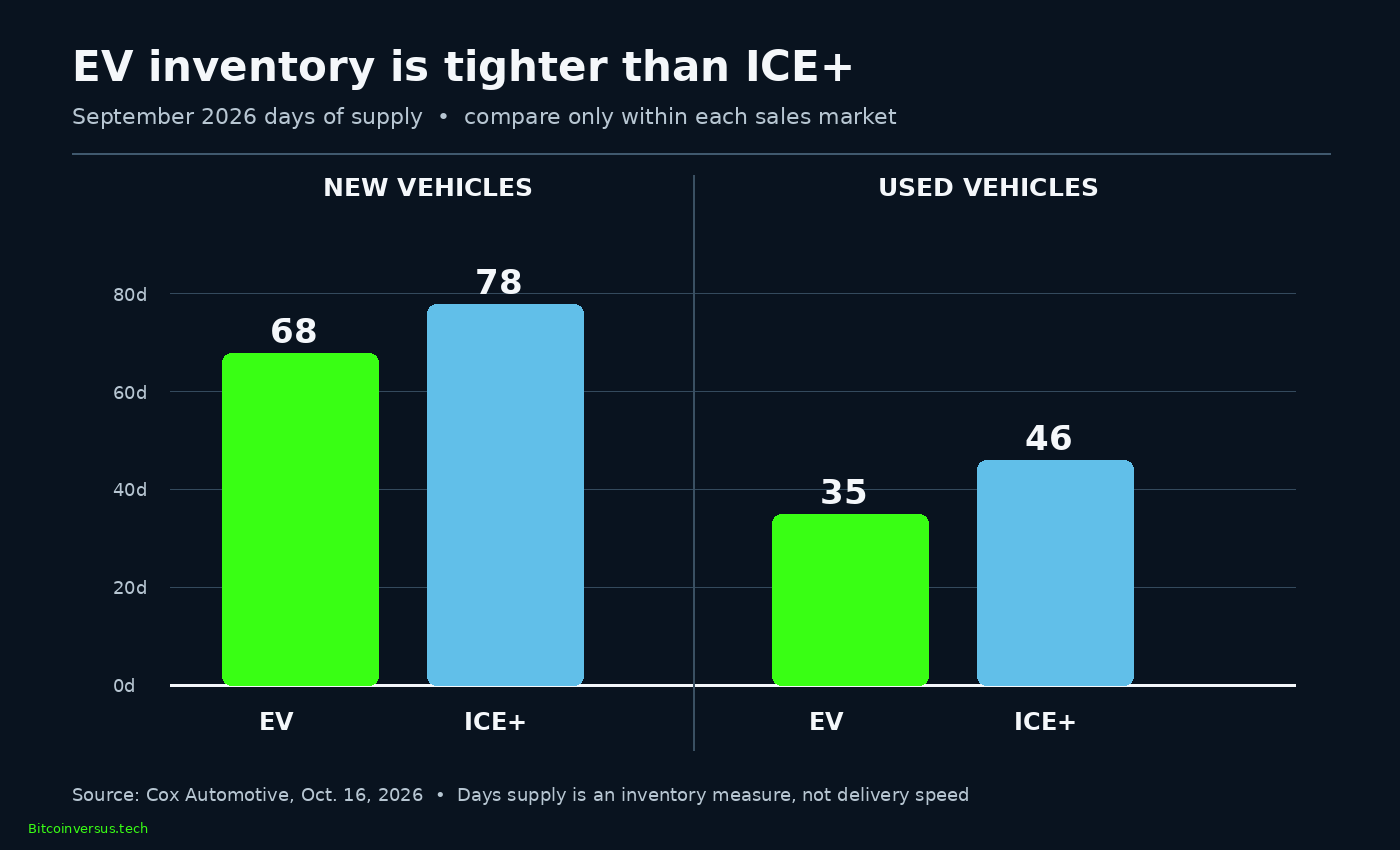
Cox reported 35 days of used-EV supply, compared with 46 days for its ICE+ comparison group. New EV inventory measured 68 days, versus 78 days for other new vehicles in the same comparison group. Days of supply expresses inventory relative to sales pace; it is not the time required to charge, deliver or resell an individual vehicle.
Technology remains central to resale value. Batteries, charging compatibility and real-world range affect buyer decisions; earlier EPA-range comparisons, regenerative-braking guidance and battery-testing coverage address distinct ownership considerations. None proves the September used-sales growth was caused by a specific technology improvement.
The rising availability of off-lease vehicles broadens secondhand choice, while tax incentives, insurance, charging access and financing still affect affordability. Buyers comparing EVs with conventional hybrids should examine total ownership costs instead of relying on average national prices.
Cox’s figures portray two different market phases: a new-EV market adjusting after an exceptional 2025 comparison period, and a used-EV market gaining share as prices and supply evolve. The next test is whether growth in used transactions continues without assuming that weaker new sales and stronger used sales represent the same customers.
Primary sources: Cox Automotive, EV Market Monitor, October 16, 2026; Cox Automotive Auto Market Snapshot; Cox Automotive Q3 EV market commentary, October 12. Independent check: InsideEVs, October 19. Video: Kelley Blue Book official EV ownership explainer, August 31.
Editor’s Note: Sales, market share, pricing and inventory figures are estimates attributed to Cox Automotive and Kelley Blue Book; BitcoinVersus.Tech has not independently audited vehicle registrations or individual transactions. New-EV transaction prices and used-EV listing prices are different metrics and are not treated as directly equivalent. All charts use published data and a zero baseline. The cover and charts are original explanatory graphics, not photographs. The Kelley Blue Book video is historical consumer context; independent player playback remains to be tested.
Support BitcoinVersus.Tech
To support independent technology reporting, scan the original donation QR below for an optional 5,000-satoshi contribution. On a phone, display the code on another screen and scan with a compatible Bitcoin wallet, or import the saved QR image if supported. Verify the destination and amount before confirming payment.

We volunteer daily to ensure the information on this platform is Verifiably True. If you would like to support the research, please scan QR code.


Leave a Reply