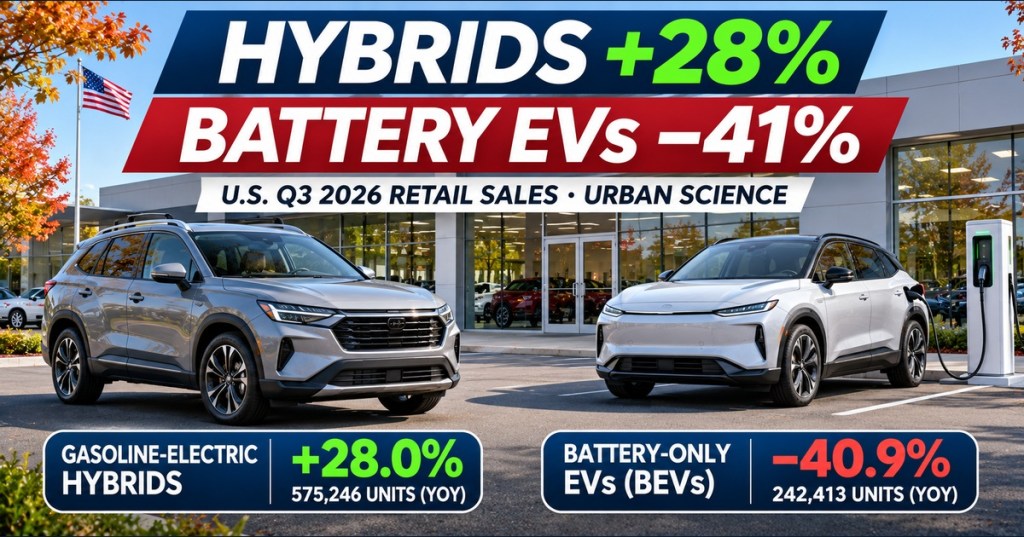
American buyers purchased 575,246 new conventional hybrid vehicles during the third quarter of 2026, a 28% increase from a year earlier, while retail sales of battery-electric vehicles fell 40.9% to 242,413. The figures come from Urban Science’s October 29 national retail-sales analysis, which also counted 44,672 plug-in hybrids, down 38%. The contrasting results show gasoline-electric hybrids supporting the broader electrified market as vehicles requiring external charging lose momentum.
Hybrids lead the 862,331 electrified vehicles sold
Urban Science recorded 3,255,572 new light-duty vehicles sold at retail in July–September 2026. Of those, 862,331 were electrified, a combined 26.5% market share. Conventional hybrids accounted for 17.7% of retail transactions, battery-only vehicles 7.4%, and plug-in hybrids 1.4%. All three segments reconcile exactly to the published electrified-vehicle total.
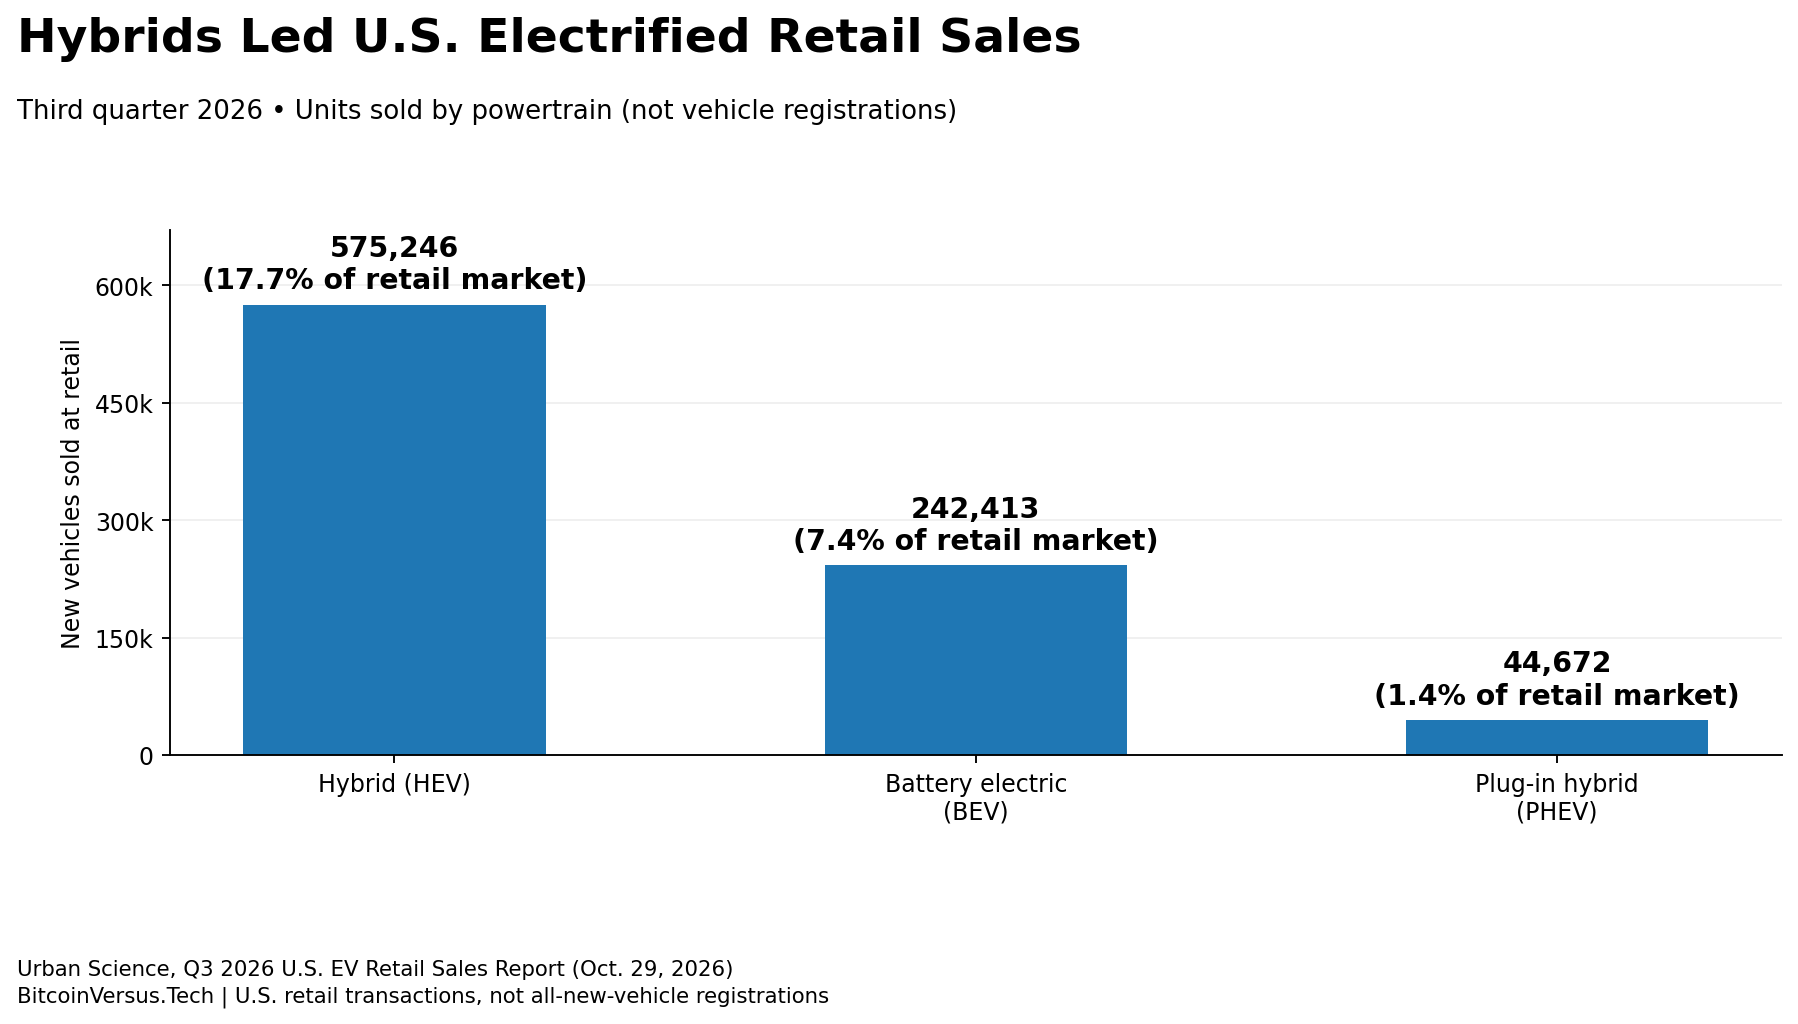
A conventional hybrid combines an internal-combustion engine with an electric motor and typically cannot be plugged in. Battery-electric cars require external electricity; plug-in hybrids use both a larger rechargeable battery and a combustion engine. BitcoinVersus.Tech’s hybrid-car technology explainer details the different powertrains and regenerative braking.
Battery EV sales fall 41% from a year earlier
The year-over-year trend is more dramatic than the combined market share suggests. Hybrid unit sales rose 28.0%, while battery-electric sales declined 40.9% and plug-in hybrids fell 38.0%. Combined electrified retail sales slipped 7.4%, versus a 2.6% decline across all new retail vehicle sales. Hybrids therefore helped stabilize the category without preventing an overall volume decrease.
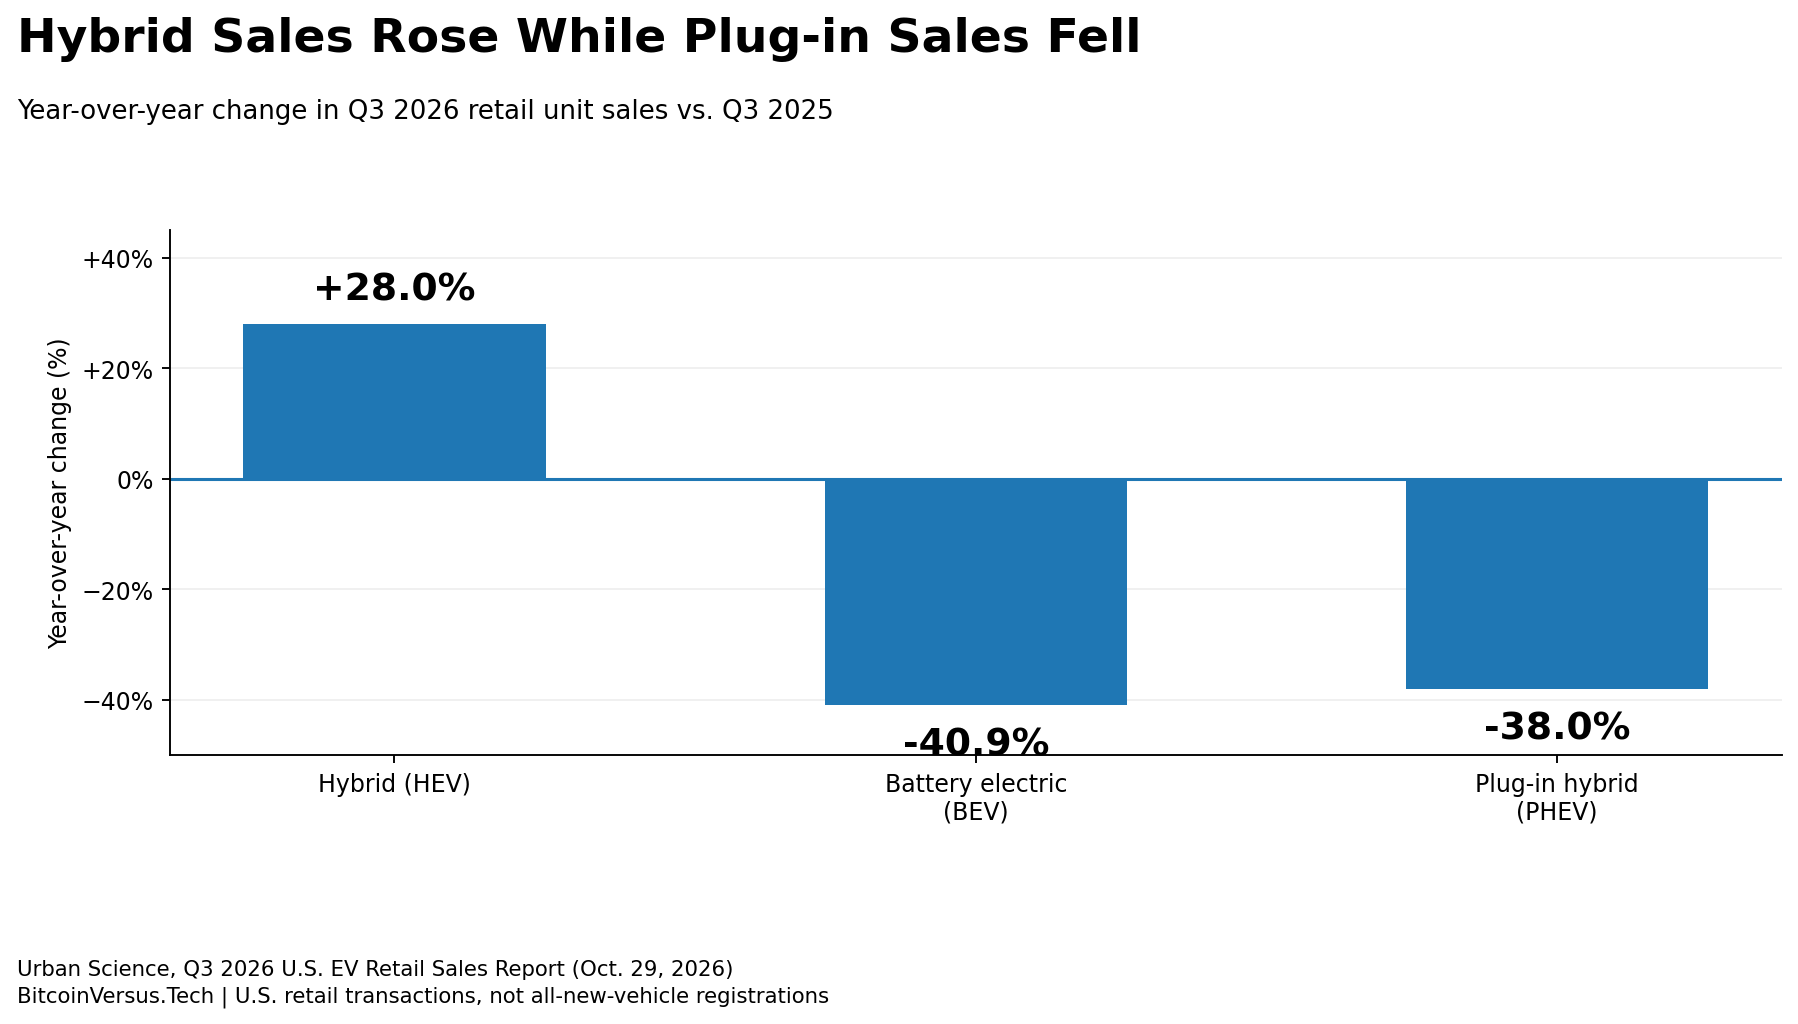
The U.S. Energy Information Administration reports a separate, broader new-vehicle market series using Omdia estimates. Under that methodology, battery-electric share fell from 10% in third-quarter 2025 to 6% in third-quarter 2026. Urban Science’s 7.4% figure measures retail transactions; mixing the two denominators would produce a misleading comparison. Federal clean-vehicle tax credits ended September 30, 2025, creating an elevated prior-year sales comparison. The timing alone does not prove how much of the decline was caused by the expiration.
Used battery-electric sales grow 68%
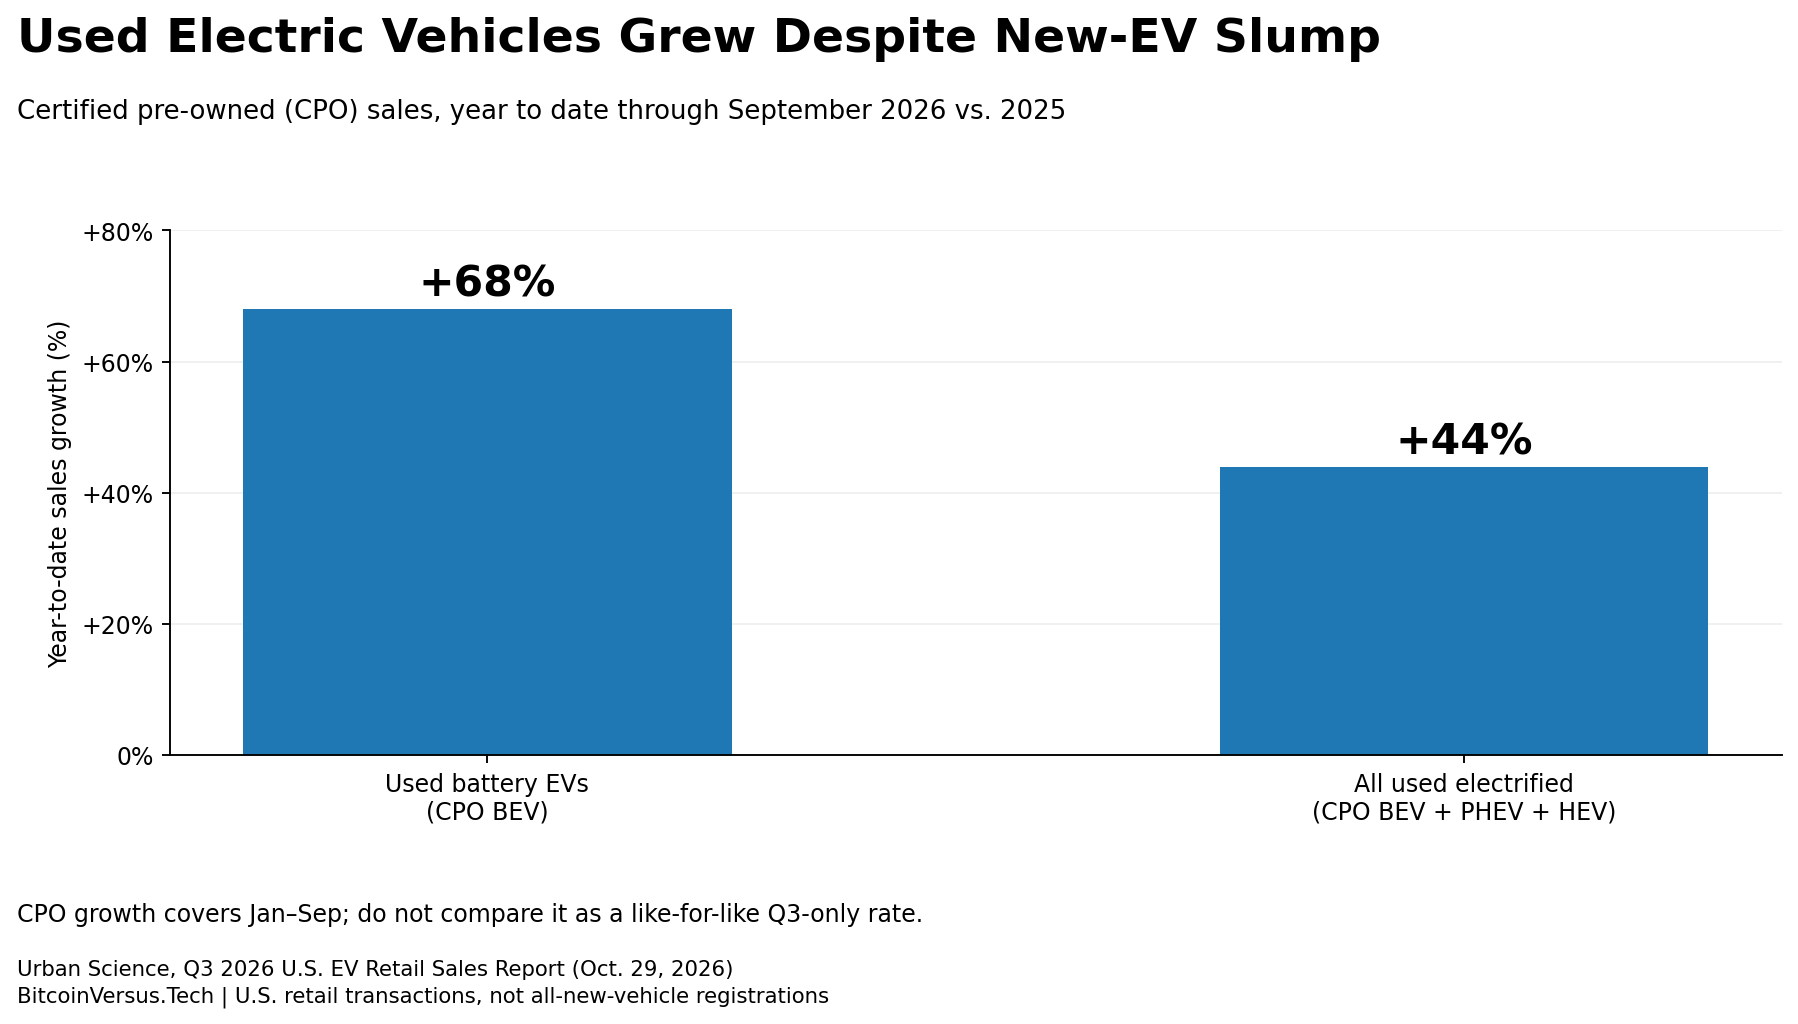
The new-car slowdown has not affected every part of the market equally. Urban Science reports certified pre-owned battery-electric sales rose 68% in the first nine months of 2026 versus the comparable 2025 period. Combined certified pre-owned hybrid, plug-in hybrid, and battery-electric sales increased 44%. Those are year-to-date used-vehicle growth rates, not third-quarter-only new-car results.
For manufacturers, the split complicates product planning. BitcoinVersus.Tech recently examined BMW’s rising company-specific electric share and Rivian’s R2 deliveries; individual automaker gains do not contradict a declining national retail segment. Similarly, GM’s future battery-efficiency targets remain engineering projections rather than proof of stronger sales.
The takeaway is a market dividing by powertrain and price segment. Used BEV demand is growing quickly from its own base, while new hybrids currently dominate electrified retail volume. Purchase prices, financing, charging availability, incentives and product mix will determine whether battery-electric retail sales recover; quarterly figures alone cannot establish the next trend.
Editor’s Note: Updated November 8, 2026. The Q3 2026 U.S. retail sales counts, year-over-year growth rates, and used-vehicle comparisons were verified against Urban Science’s October 29 research report. The reported sales categories sum to 575,246 + 242,413 + 44,672 = 862,331 electrified vehicles, representing approximately 26.5% of 3,255,572 total new retail vehicles. EIA’s October 19 analysis uses Omdia’s broader sales estimates and is intentionally not combined with Urban Science retail shares. All three charts use the cited Urban Science dataset; the cover is a conceptual illustration depicting representative, unbranded vehicles, not real dealership photography. Certified pre-owned figures cover January through September rather than Q3 alone. No unverified social or video embed was inserted.

To donate 5,000 sats, open the article on a separate display and scan the original QR code with a compatible Bitcoin wallet. On mobile, use another screen or your wallet’s supported image-scanning feature. Verify the destination 3C9o19EH5HSiwEPyCTmEKzxhNCbo2X6TTb before sending.
We volunteer daily to ensure the information on this platform is Verifiably True. If you would like to support the research, please scan QR code.
BitcoinVersus.Tech is not a financial advisor. Vehicle-market figures are informational and may be updated by their respective data providers.


Leave a Reply