Nebius Group’s quarterly revenue surged 571% to $980.8 million in Q3 2026, but the AI-cloud provider also spent $7.30 billion purchasing property, equipment and intangible assets. The two measures, reported November 12 for the three months ended September 30, expose the financial scale of expanding GPU computing capacity. They also raise an important question: how quickly can investment in infrastructure translate into sustained cash generation?
Nebius’s official May 2025 presentation on Hopper-to-Blackwell GPU infrastructure provides historical technical context, not footage of the Q3 2026 earnings call. The official November 12 earnings webcast is available through investor relations.
Revenue grew 571%, but one-third was non-recurring
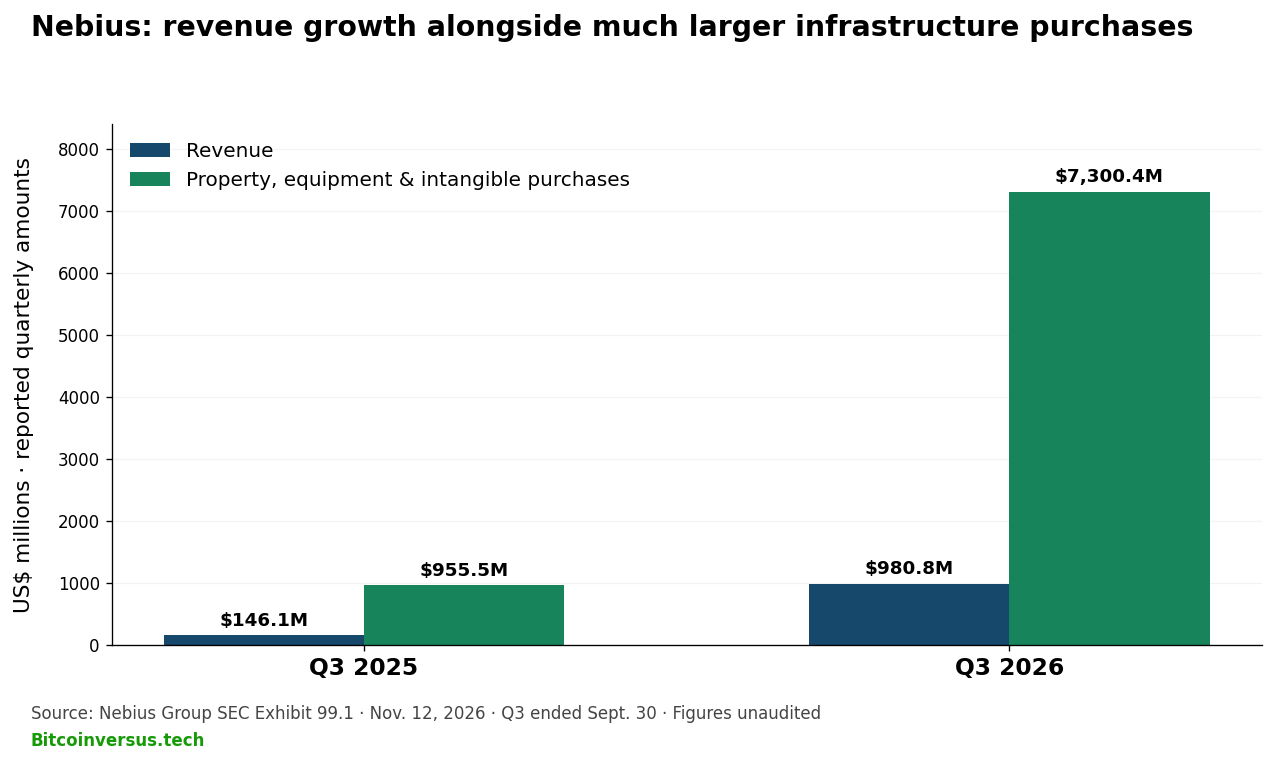
Nebius reported $146.1 million in consolidated revenue during Q3 2025 and $980.8 million a year later. The calculation, ($980.8M − $146.1M) ÷ $146.1M × 100, produces 571.3% growth and an $834.7 million increase. Its core Nebius AI Cloud operation supplied $973.8 million, approximately 99% of group revenue, according to the November 12 shareholder letter. Consolidated results also include the Avride autonomous-vehicle business and TripleTen education services.
A critical qualification sits behind the headline. Management identified approximately $325 million in non-recurring Q3 revenue associated with an initial rollout of its “asset-light” partnership model. That amount equals roughly 33.1% of consolidated revenue. Removing it arithmetically leaves $655.8 million, but the result is not an audited recurring-revenue measure or a like-for-like organic-growth calculation. Nebius expects partnership revenue to become more regular, a forward-looking expectation rather than a completed trend.
Infrastructure purchases reached 7.44 times quarterly sales
The company’s SEC-filed cash-flow statement records $7,300.4 million in purchases of property, equipment and intangible assets, versus $955.5 million in Q3 2025. Growth was ($7,300.4M − $955.5M) ÷ $955.5M × 100 = 664.0%. Dividing Q3 2026 purchases by quarterly revenue gives 7.44 times; the comparable 2025 ratio was 6.54 times. Both values compare flows over the same three-month reporting periods.
The spending line is a cash-flow measure, not a count of installed accelerators or energized megawatts. Payments may cover buildings, compute equipment, electrical infrastructure and intangible assets. By comparison, IDC’s global AI infrastructure spending estimates measure a different market and cannot be added to Nebius’s accounts.
Operating profit does not equal positive operating cash flow
Nebius recorded $50.4 million in GAAP operating income, yet still reported a $37.5 million net loss from continuing operations and $273.0 million of cash used in continuing operating activities. Its $465.8 million adjusted EBITDA is a non-GAAP measure and excludes significant charges. The difference matters because revenue, EBITDA, net income and cash generation describe separate dimensions of financial health.
The expansion has a physical counterpart: a proposed South Carolina project converting a former Bitcoin mine into a 50 MW AI site illustrates why contracted power and future construction should not be confused with operational compute. High-density racks require transformers, cooling, electricity and networking; power-semiconductor demand is rising alongside infrastructure investment.
Forecasts shift as capacity schedules change
Management now expects 2026 revenue near the lower end of a $3.0 billion–$3.4 billion range after third-party capacity scheduled for late 2026 slipped into the first half of 2027. It forecasts roughly $27 billion of 2026 capital expenditures, $12 billion–$13 billion in 2027 revenue and $40 billion–$45 billion in 2027 capital expenditures. The company says prepayments and asset-backed financing could cover 75%–85% of future capital spending. All are management forecasts, not realized results. Its larger cloud-services market is growing, but industry demand alone cannot establish Nebius’s project returns.
The next useful indicators are completed and energized capacity, quarterly recurring-revenue quality, utilization, customer concentration, operating cash flow and financing obligations—not merely the scale of new contracts or equipment purchases.
Sources and methodology: Nebius, SEC Exhibit 99.1, November 12, 2026; Nebius shareholder letter, SEC Exhibit 99.2, November 12; company earnings announcement. Calculations use rounded company-reported quarterly figures in US$ millions. Results are unaudited; forecasts are subject to financing, deployment and customer-demand risks.
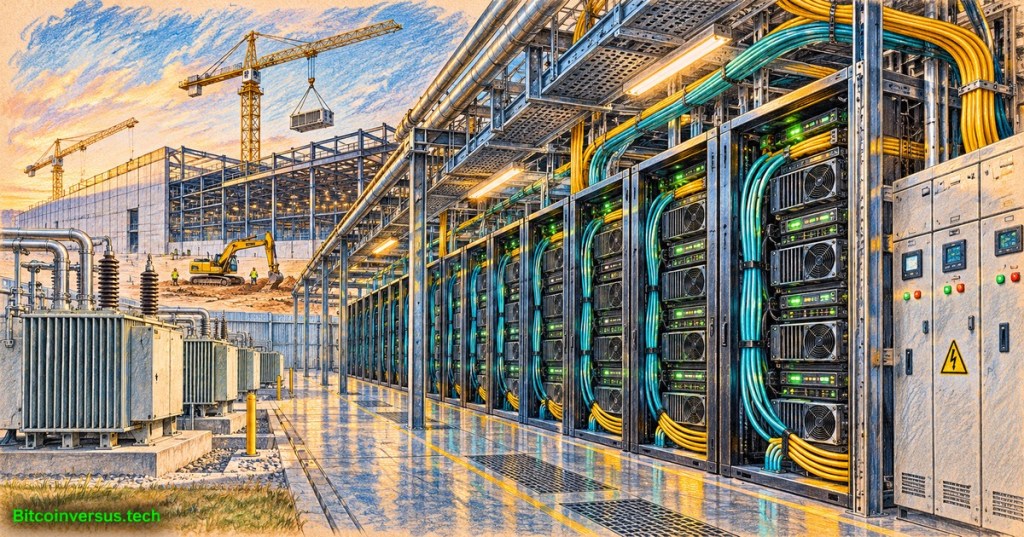
Editor’s note: Featured artwork is an original illustration, not a photograph of an identified Nebius facility. The embedded video is archival technical background. Coverage is educational and does not constitute investment advice.


Leave a Reply