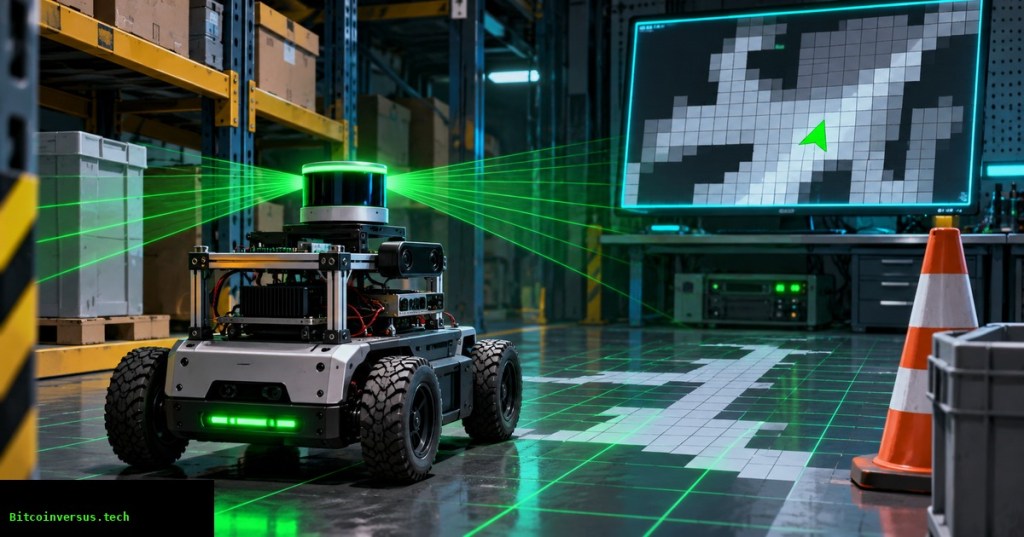
OSREC.015 explains how mobile robots convert range measurements into a probabilistic map for localization and motion planning. A LiDAR scan reports distances, not a ready-made floor plan. Mapping software combines those readings with estimated robot poses, marks likely obstacles, and gradually identifies free space. The lesson follows OSREC.014 on pose-graph SLAM, where loop closure improves the estimated path that places measurements into a map.
Elementary Overview
Imagine covering a room’s floor with many small squares. A robot points a distance sensor toward a shelf. Squares along a clear sensor beam can become more likely to be empty; the square where a valid beam meets the shelf can become more likely to contain an object. Unseen squares remain unknown. Repeated measurements gradually build a useful map, but the map is a collection of estimates, not a guarantee that the floor is safe to cross.
University of Michigan, “Lecture 12—Occupancy Grid Mapping,” Mobile Robotics: Methods & Algorithms (Winter 2022). University course explanation of probabilistic mapping and robot perception. Credit: UMich-CURLY / YouTube.
A grid stores beliefs rather than absolute truths
An occupancy grid divides a region into regularly spaced cells, each representing a belief about a small area. The common occupied-probability convention assigns 0 to a definitely free cell, 1 to a definitely occupied cell, and 0.5 to unknown. The Mobile Robot Programming Toolkit (MRPT) documents an important exception: its public cell values represent freeness, where 0 indicates occupied and 1 indicates empty. Converting between libraries without examining semantics can invert an entire map.
A 20-metre by 12-metre area with 0.05-metre cells needs 400 columns and 240 rows, or 96,000 cells. At one signed byte per cell, the raw cell array occupies 96,000 bytes before metadata, padding, other map layers or application storage. Smaller cells can represent finer features but consume additional memory and processing. Resolution alone cannot increase sensor accuracy.
Why log-odds makes repeated updates practical
For an occupied probability p, the log-odds value is L = ln[p / (1 − p)]. A prior probability of 0.5 corresponds to zero log-odds. With a consistent inverse sensor model, each independent observation contributes an additive increment; a free-space observation usually lowers the occupancy log-odds, while a credible obstacle return raises it. The prior contribution must be handled correctly rather than repeatedly added. Practical implementations clamp updates to avoid runaway confidence.
For example, an assumed occupied probability of 0.7 has log-odds about +0.847. Under an illustrative independent-observation model and a neutral prior, two identical increments produce about +1.695, equivalent to an occupied probability of roughly 0.845. The example demonstrates the mathematics—not measured performance of any specific LiDAR. Correlated observations, calibration error or an inaccurate sensor model can make repeated measurements less informative than the numbers suggest.
NPTEL / Indian Institute of Technology Madras, “Occupancy Grid Mapping,” November 30, 2020. University-level robotics lesson explaining probabilistic cells and range-sensor updates. Credit: NPTEL-NOC IITM / YouTube.
Tracing rays from the sensor to the measured endpoint
A 2D LiDAR return becomes useful only after transforming its direction and range from the sensor frame through the robot frame into the mapping frame. A valid detection can mark an endpoint cell as occupied while cells traversed by the ray provide evidence of free space. Cells beyond an obstacle must not be automatically cleared: the sensor did not observe behind the obstruction. Similarly, a maximum-range or missing return should follow the sensor’s documented validity rules, not an assumption that every cell along the line is empty.
Beam width, transparent surfaces, moving people, reflective metal, multipath readings and timing errors can complicate the updates. The Nav2 obstacle-layer documentation distinguishes marking from clearing and provides separate obstacle and raytracing range settings. Defaults are configuration facts, not safe values for every vehicle.
Mapping, localization and planning are different layers
A map estimates what occupies the environment. Localization estimates the robot’s position relative to the map. Planning identifies candidate motion through permitted space. OSREC.013 on state estimation explains why pose uncertainty affects where sensor returns land. Large localization drift can turn the same wall into multiple apparent obstacles. Graph-based correction may realign historical observations, but a downstream map must still be rebuilt or corrected according to the chosen SLAM architecture.
In ROS 2, nav_msgs/OccupancyGrid represents a two-dimensional probability map, whereas a Nav2 costmap adds planning-oriented information such as obstacle marking and inflation around hazards. The official Nav2 mapping and localization guide gives an example with static, obstacle and inflation layers. An inflated navigation cost is not an occupied-probability measurement; confusing the two can break the planner’s interpretation.
Felipe Tambasco, “ROS2 Nav2 Tutorial | Create a Map With slam_toolbox, Nav2 and Ignition Gazebo,” August 10, 2026. Independent walkthrough demonstrating simulated map building, navigation and map export; implementation details depend on installed ROS distributions. Credit: Felipe Tambasco / YouTube.
Practical verification without touching a live robot
For an engineering review, record map resolution and origin, sensor frame and timestamps, expected LiDAR range, missing-return treatment, free/occupied thresholds and the selected update model. Replay a controlled dataset while comparing resulting occupied cells with known walls and free corridors. Check whether the map changes unexpectedly when identical data is replayed, when a robot turns, or when the pose estimate is intentionally perturbed. Save both quantitative results and the input dataset version for reproducibility.
An occupancy grid is not a safeguarding device. Human detection, certified protective stopping and restart control belong to separate validated systems; OSRTC.018 on safety laser scanners outlines that distinction. Likewise, a planner constrained by a map may still require OSREC.012 on safety filters and application-specific validation. A visually convincing map cannot prove reliable sensing in an occupied workplace.
Elementary Conclusion
A robot turns distance measurements into a map by treating each small square as a question: “Is something here?” Every reliable observation can make its answer more confident. The map becomes more useful when the robot also knows where it was during each measurement. Engineers must still check the sensor readings, position estimates and navigation rules, because an incorrect map can lead a robot toward a real obstacle.
Editor’s Note: Technical definitions, numerical conventions and map-processing behavior were checked against original MRPT, ROS 2 and Nav2 documentation. The first two in-story lectures are from university channels; the third is an independent ROS demonstration. The featured 1200 × 630 cinematic anime scene is original conceptual artwork, not a photograph of a real robot or a validated grid. Public YouTube player playback, mobile screenshots and physical-robot performance were not independently tested. No original custom schematic is embedded in the article.

BitcoinVersus.Tech publishes independent technical education through volunteer contributions. An optional 5,000-satoshi donation supports ongoing research. Scan the original QR using a compatible Bitcoin wallet from a second screen; when reading on the same phone, use a wallet capable of importing a saved QR image. Independently verify recipient 3C9o19EH5HSiwEPyCTmEKzxhNCbo2X6TTb and amount before sending. Bitcoin payments are generally irreversible.
We volunteer daily to ensure the information on BitcoinVersus.Tech is Verifiably True. The lesson is informational and educational, not permission to operate, modify or bypass live robotic safety systems and not a substitute for qualified engineering approval, financial advice or investment advice.


Leave a Reply